CooperCompanies’s (NASDAQ:COO) Q1 Sales Beat Estimates

Medical device company CooperCompanies (NASDAQ: COO) reported Q1 CY2025 results exceeding the market’s revenue expectations, with sales up 6.3% year on year to $1 billion. The company expects the full year’s revenue to be around $4.13 billion, close to analysts’ estimates. Its non-GAAP profit of $0.96 per share was 3.3% above analysts’ consensus estimates.
Is now the time to buy CooperCompanies? Find out by accessing our full research report, it’s free.
CooperCompanies (COO) Q1 CY2025 Highlights:
- Revenue: $1 billion vs analyst estimates of $994.1 million (6.3% year-on-year growth, 0.8% beat)
- Adjusted EPS: $0.96 vs analyst estimates of $0.93 (3.3% beat)
- The company slightly lifted its revenue guidance for the full year to $4.13 billion at the midpoint from $4.12 billion
- Management raised its full-year Adjusted EPS guidance to $4.08 at the midpoint, a 2.5% increase
- Operating Margin: 18.4%, up from 17.2% in the same quarter last year
- Organic Revenue rose 7% year on year (8.5% in the same quarter last year)
- Market Capitalization: $16.02 billion
Commenting on the results, Al White, CooperCompanies' President and CEO said, "This was another solid quarter driven by double-digit growth in CooperVision's daily silicone hydrogel portfolio and CooperSurgical's office and surgical portfolio. As we move forward, our teams remain focused on taking share, delivering leverage, launching products and completing capacity expansion projects."
Company Overview
With a history dating back to 1958 and a portfolio spanning two distinct healthcare segments, Cooper Companies (NASDAQ: COO) develops and manufactures medical devices focused on vision care through contact lenses and women's health including fertility products and services.
Sales Growth
Examining a company’s long-term performance can provide clues about its quality. Even a bad business can shine for one or two quarters, but a top-tier one grows for years. Luckily, CooperCompanies’s sales grew at a decent 9.4% compounded annual growth rate over the last five years. Its growth was slightly above the average healthcare company and shows its offerings resonate with customers.
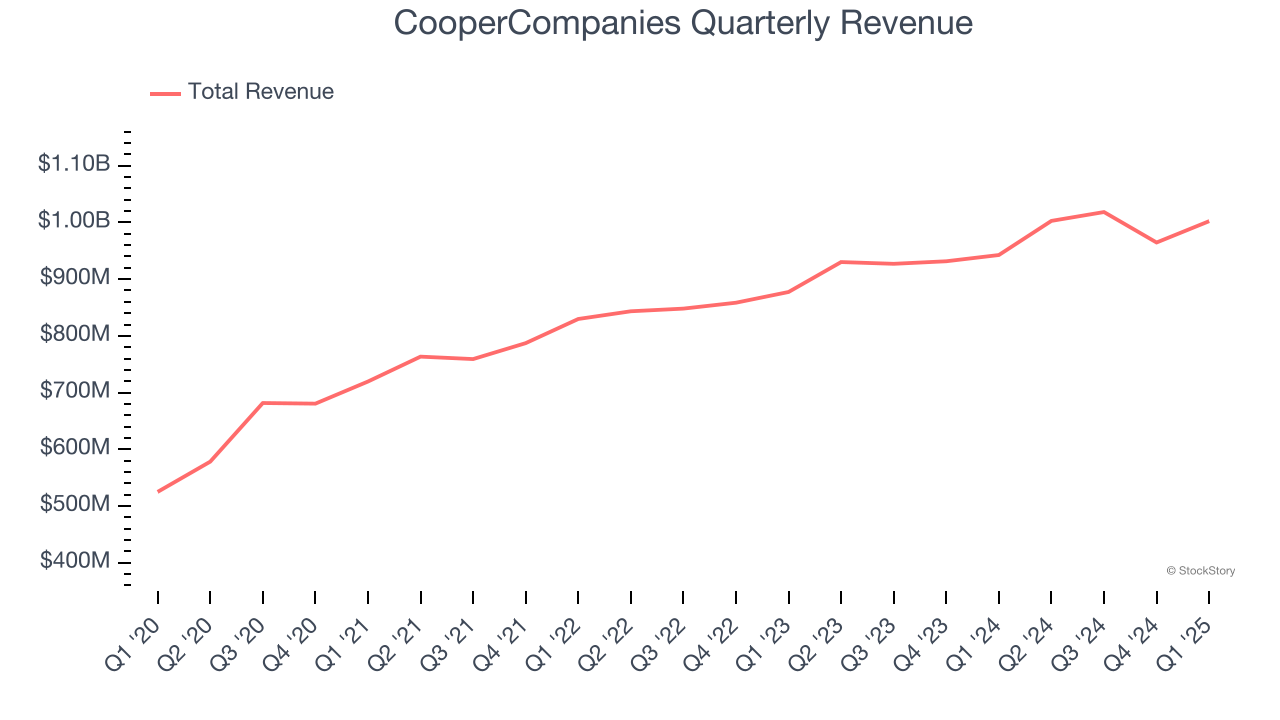
Long-term growth is the most important, but within healthcare, a half-decade historical view may miss new innovations or demand cycles. CooperCompanies’s annualized revenue growth of 7.9% over the last two years is below its five-year trend, but we still think the results were respectable. 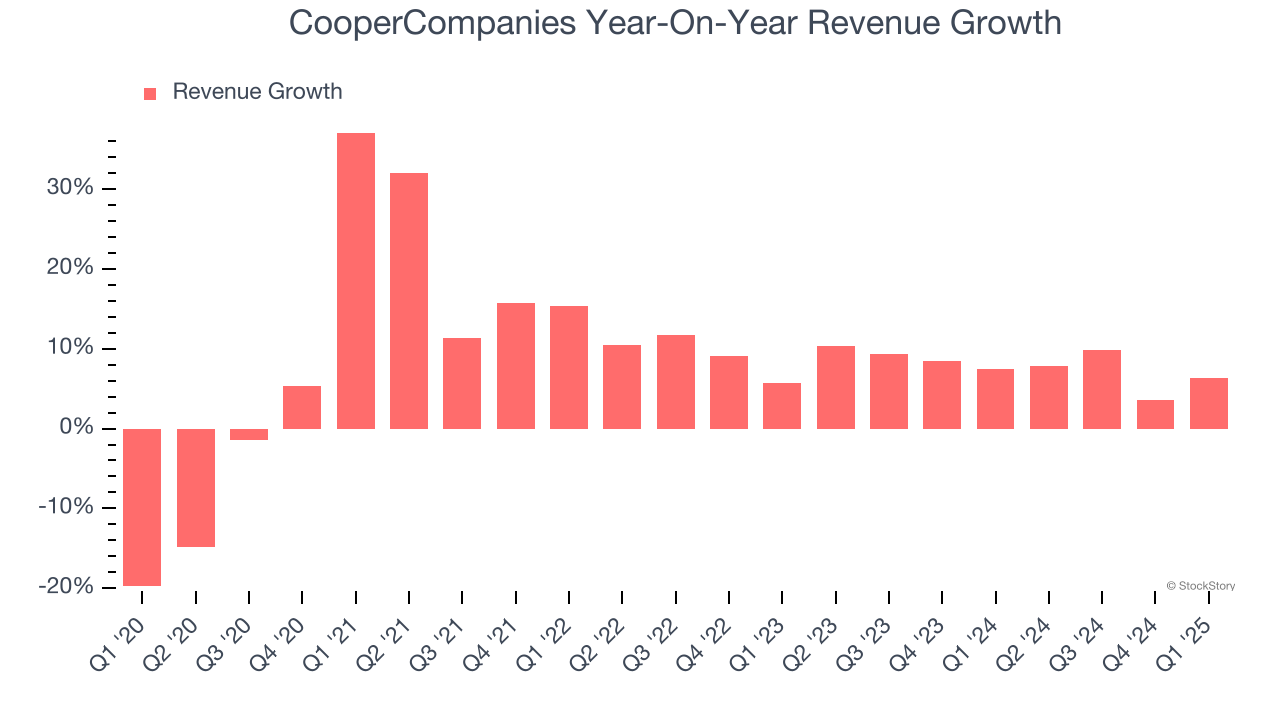
CooperCompanies also reports organic revenue, which strips out one-time events like acquisitions and currency fluctuations that don’t accurately reflect its fundamentals. Over the last two years, CooperCompanies’s organic revenue averaged 8% year-on-year growth. Because this number aligns with its normal revenue growth, we can see the company’s core operations (not acquisitions and divestitures) drove most of its results. 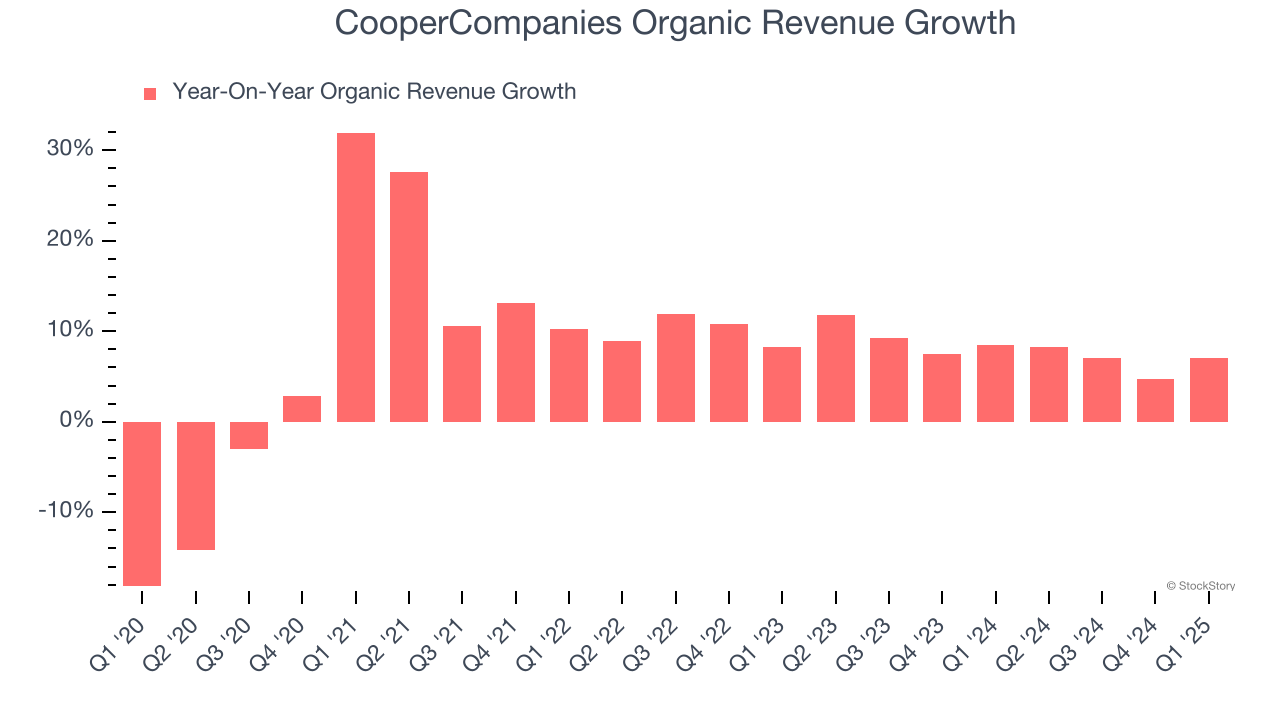
This quarter, CooperCompanies reported year-on-year revenue growth of 6.3%, and its $1 billion of revenue exceeded Wall Street’s estimates by 0.8%.
Looking ahead, sell-side analysts expect revenue to grow 6.5% over the next 12 months, similar to its two-year rate. Despite the slowdown, this projection is above average for the sector and implies the market sees some success for its newer products and services.
Software is eating the world and there is virtually no industry left that has been untouched by it. That drives increasing demand for tools helping software developers do their jobs, whether it be monitoring critical cloud infrastructure, integrating audio and video functionality, or ensuring smooth content streaming. Click here to access a free report on our 3 favorite stocks to play this generational megatrend.
Operating Margin
Operating margin is an important measure of profitability as it shows the portion of revenue left after accounting for all core expenses – everything from the cost of goods sold to advertising and wages. It’s also useful for comparing profitability across companies with different levels of debt and tax rates because it excludes interest and taxes.
CooperCompanies has managed its cost base well over the last five years. It demonstrated solid profitability for a healthcare business, producing an average operating margin of 16.5%.
Looking at the trend in its profitability, CooperCompanies’s operating margin rose by 2.1 percentage points over the last five years, as its sales growth gave it operating leverage. This performance was mostly driven by its recent improvements as the company’s margin has increased by 4.7 percentage points on a two-year basis.
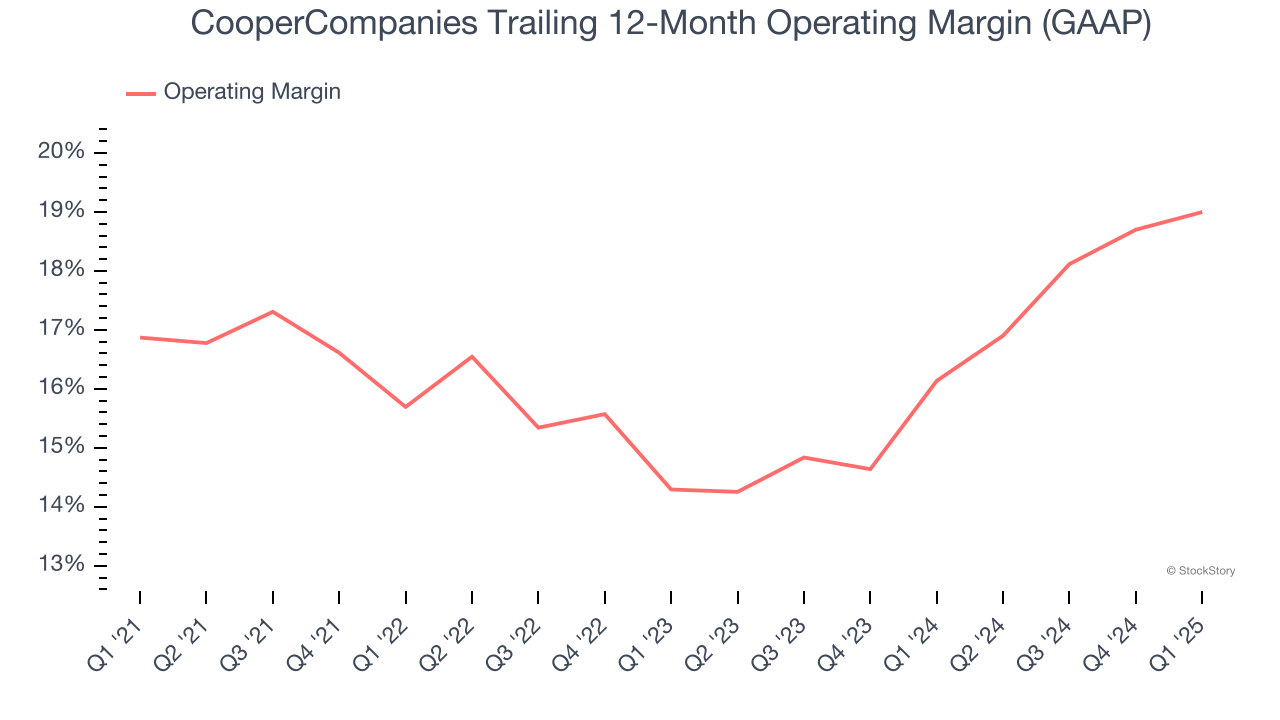
In Q1, CooperCompanies generated an operating margin profit margin of 18.4%, up 1.3 percentage points year on year. This increase was a welcome development and shows it was more efficient.
Earnings Per Share
We track the long-term change in earnings per share (EPS) for the same reason as long-term revenue growth. Compared to revenue, however, EPS highlights whether a company’s growth is profitable.
CooperCompanies’s EPS grew at a solid 7.7% compounded annual growth rate over the last five years. Despite its operating margin expansion during that time, this performance was lower than its 9.4% annualized revenue growth, telling us that non-fundamental factors such as interest and taxes affected its ultimate earnings.
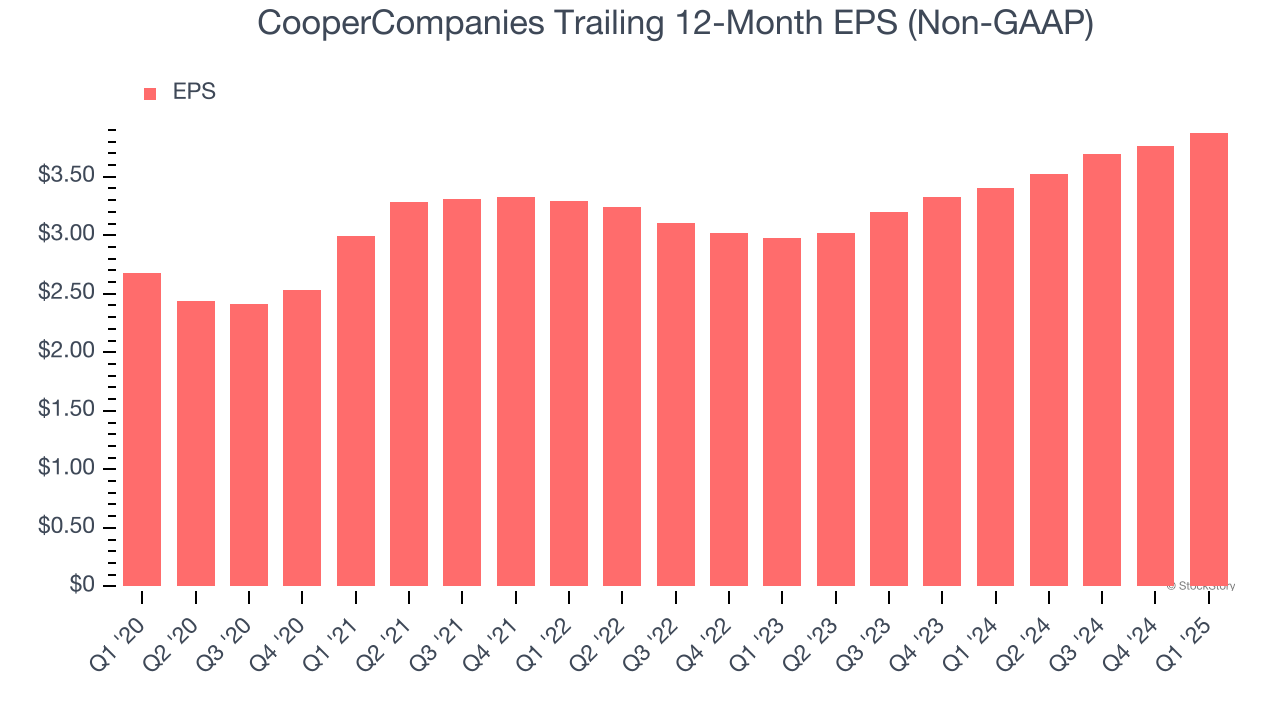
We can take a deeper look into CooperCompanies’s earnings quality to better understand the drivers of its performance. A five-year view shows CooperCompanies has diluted its shareholders, growing its share count by 1.2%. This dilution overshadowed its increased operating efficiency and has led to lower per share earnings. Taxes and interest expenses can also affect EPS but don’t tell us as much about a company’s fundamentals. 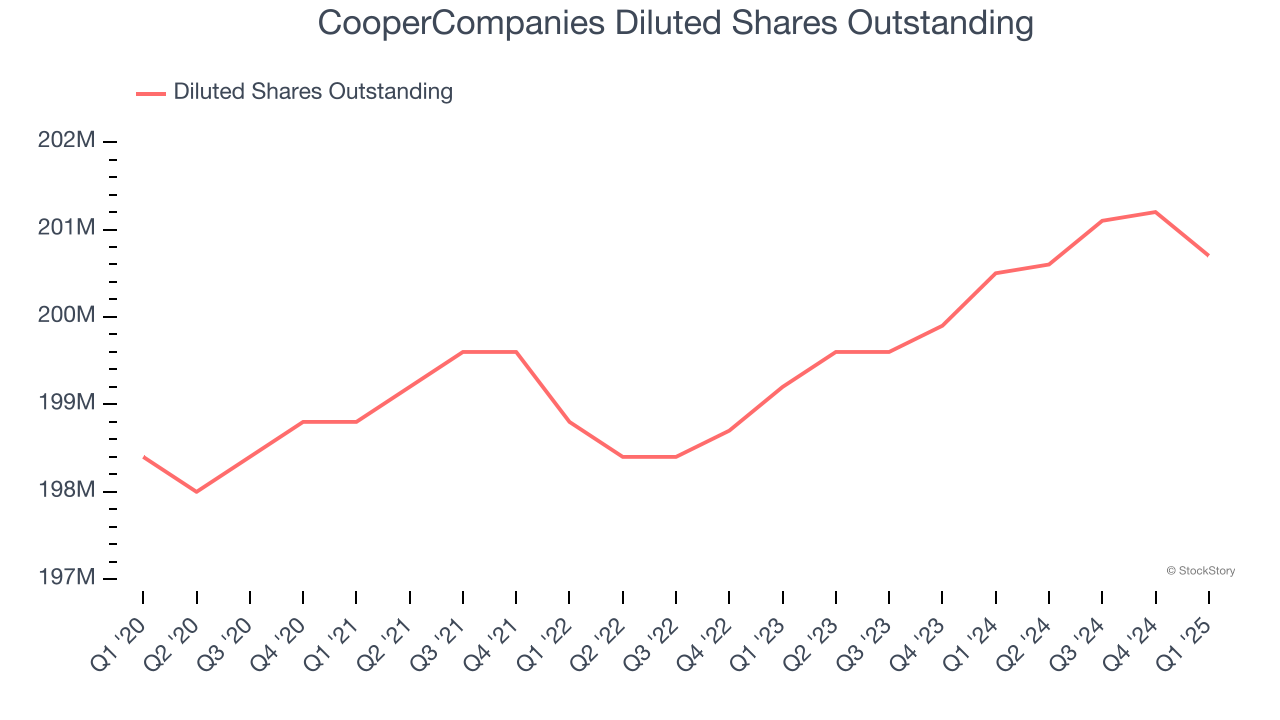
In Q1, CooperCompanies reported EPS at $0.96, up from $0.85 in the same quarter last year. This print beat analysts’ estimates by 3.3%. Over the next 12 months, Wall Street expects CooperCompanies’s full-year EPS of $3.88 to grow 8.2%.
Key Takeaways from CooperCompanies’s Q1 Results
It was encouraging to see CooperCompanies raise its full-year revenue and EPS guidance. We were also happy its organic revenue and EPS outperformed Wall Street’s estimates. Overall, this print had some key positives. Investors were likely hoping for more, and shares traded down 4% to $76.81 immediately following the results.
Should you buy the stock or not? If you’re making that decision, you should consider the bigger picture of valuation, business qualities, as well as the latest earnings. We cover that in our actionable full research report which you can read here, it’s free.
More News
View More


Recent Quotes
View More
Quotes delayed at least 20 minutes.
By accessing this page, you agree to the Privacy Policy and Terms Of Service.