AECOM (NYSE:ACM) Reports Sales Below Analyst Estimates In Q1 Earnings

Infrastructure consulting service company AECOM (NYSE: ACM) fell short of the market’s revenue expectations in Q1 CY2025, with sales falling 4.4% year on year to $3.77 billion. Its non-GAAP profit of $1.25 per share was 4.8% above analysts’ consensus estimates.
Is now the time to buy AECOM? Find out by accessing our full research report, it’s free.
AECOM (ACM) Q1 CY2025 Highlights:
- Revenue: $3.77 billion vs analyst estimates of $4.17 billion (4.4% year-on-year decline, 9.5% miss)
- Adjusted EPS: $1.25 vs analyst estimates of $1.19 (4.8% beat)
- Adjusted EBITDA: $290 million vs analyst estimates of $287.2 million (7.7% margin, 1% beat)
- Management slightly raised its full-year Adjusted EPS guidance to $5.15 at the midpoint
- EBITDA guidance for the full year is $1.20 billion at the midpoint, in line with analyst expectations
- Operating Margin: 6.8%, up from 5.1% in the same quarter last year
- Free Cash Flow Margin: 4.7%, up from 1.9% in the same quarter last year
- Backlog: $24.27 billion at quarter end, up 2.2% year on year
- Market Capitalization: $13.58 billion
“Even with impacts resulting from changing political dynamics around the world, we continue to deliver on our financial and strategic objectives, just as we have over the past several years, and we are increasing our financial guidance for a second consecutive quarter as a result,” said Troy Rudd, AECOM’s chairman and chief executive officer.
Company Overview
Founded in 1990 when a group of engineers from five companies decided to merge, AECOM (NYSE: ACM) provides various infrastructure consulting services.
Sales Growth
Examining a company’s long-term performance can provide clues about its quality. Any business can put up a good quarter or two, but many enduring ones grow for years. Regrettably, AECOM’s sales grew at a sluggish 3.7% compounded annual growth rate over the last five years. This was below our standard for the industrials sector and is a poor baseline for our analysis.
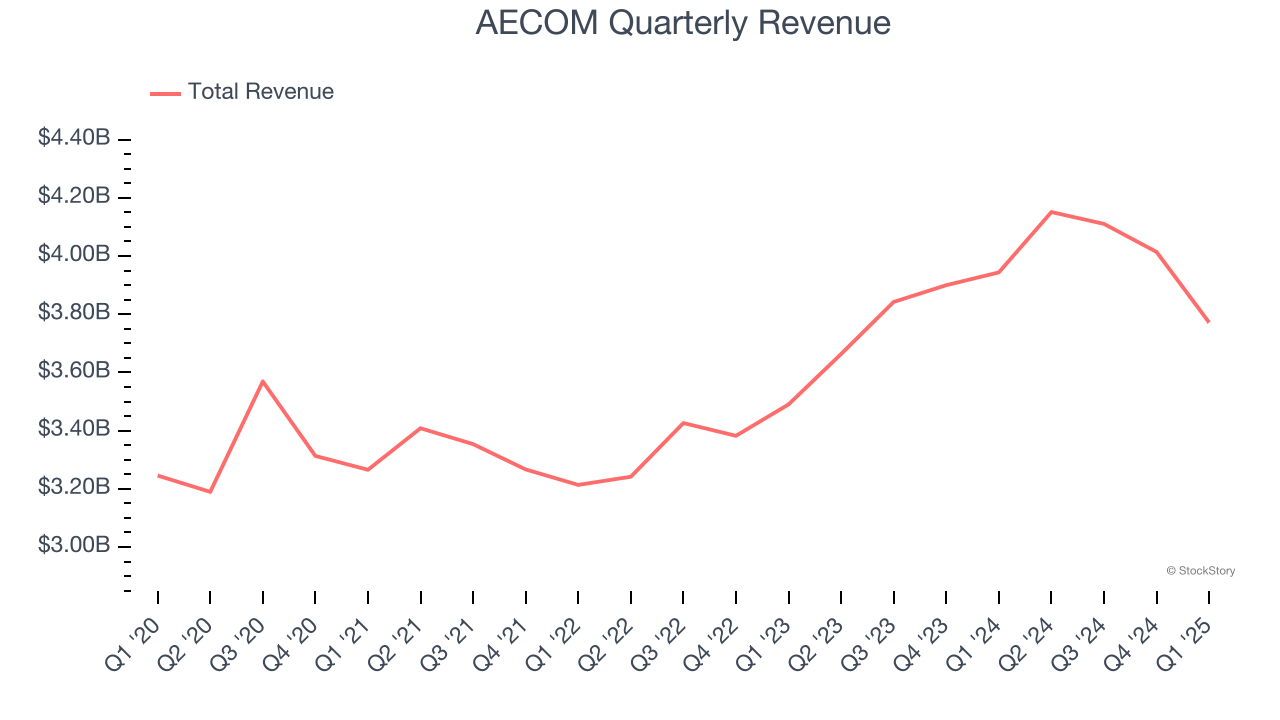
We at StockStory place the most emphasis on long-term growth, but within industrials, a half-decade historical view may miss cycles, industry trends, or a company capitalizing on catalysts such as a new contract win or a successful product line. AECOM’s annualized revenue growth of 8.9% over the last two years is above its five-year trend, suggesting some bright spots. 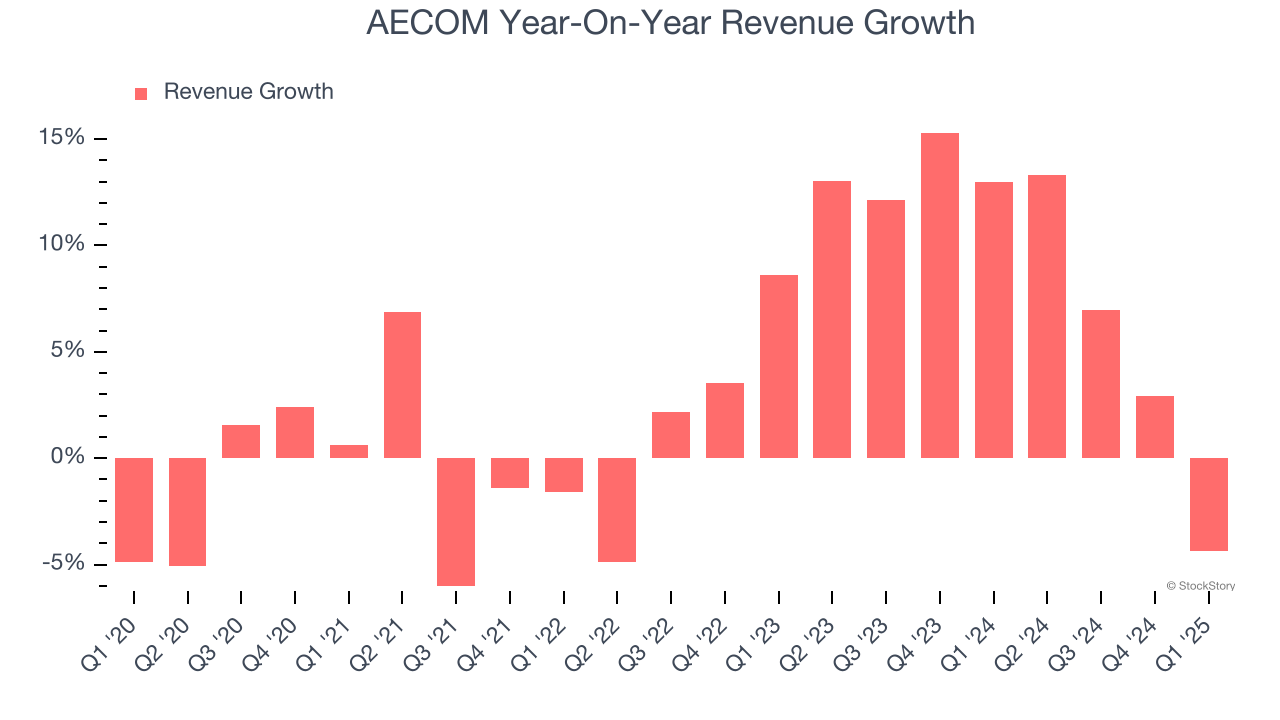
We can better understand the company’s revenue dynamics by analyzing its backlog, or the value of its outstanding orders that have not yet been executed or delivered. AECOM’s backlog reached $24.27 billion in the latest quarter and averaged 1.6% year-on-year declines over the last two years. Because this number is lower than its revenue growth, we can see the company fulfilled orders at a faster rate than it added new orders to the backlog. This implies AECOM was operating efficiently but raises questions about the health of its sales pipeline. 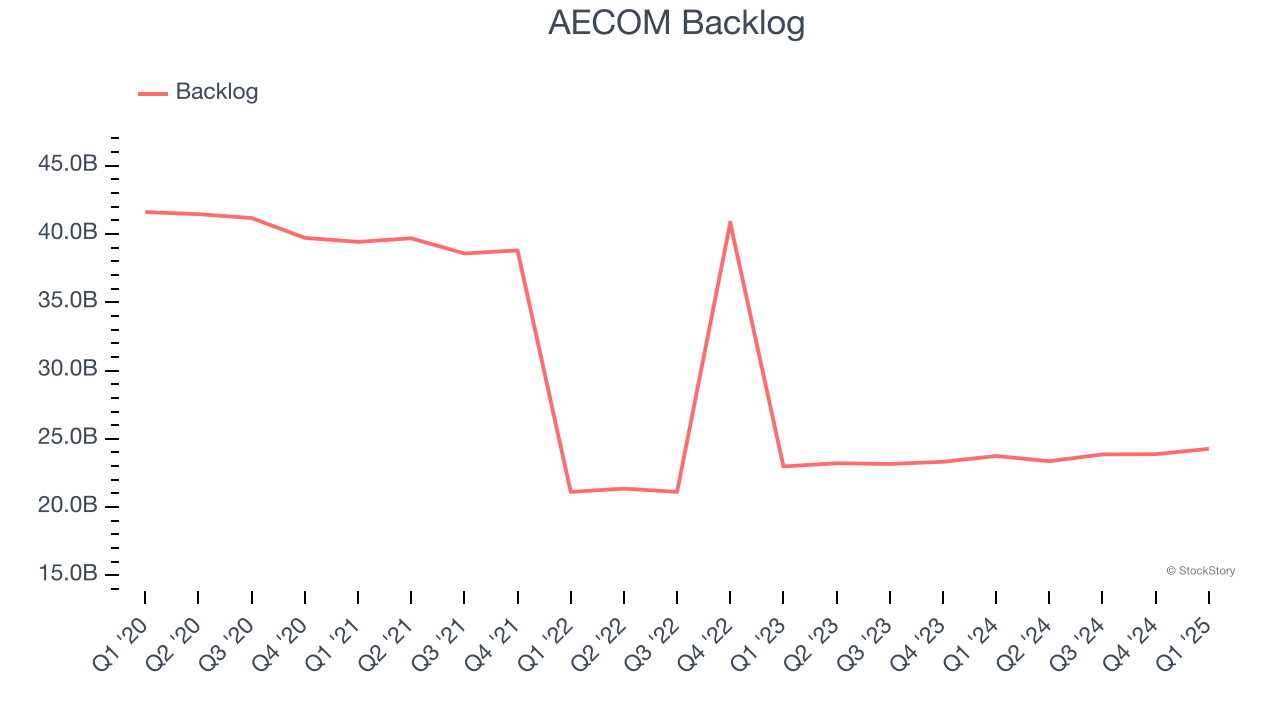
This quarter, AECOM missed Wall Street’s estimates and reported a rather uninspiring 4.4% year-on-year revenue decline, generating $3.77 billion of revenue.
Looking ahead, sell-side analysts expect revenue to grow 8.7% over the next 12 months, similar to its two-year rate. This projection is above the sector average and indicates its newer products and services will help support its recent top-line performance.
Here at StockStory, we certainly understand the potential of thematic investing. Diverse winners from Microsoft (MSFT) to Alphabet (GOOG), Coca-Cola (KO) to Monster Beverage (MNST) could all have been identified as promising growth stories with a megatrend driving the growth. So, in that spirit, we’ve identified a relatively under-the-radar profitable growth stock benefiting from the rise of AI, available to you FREE via this link.
Operating Margin
AECOM was profitable over the last five years but held back by its large cost base. Its average operating margin of 4.3% was weak for an industrials business. This result isn’t too surprising given its low gross margin as a starting point.
On the plus side, AECOM’s operating margin rose by 2.4 percentage points over the last five years, as its sales growth gave it operating leverage.
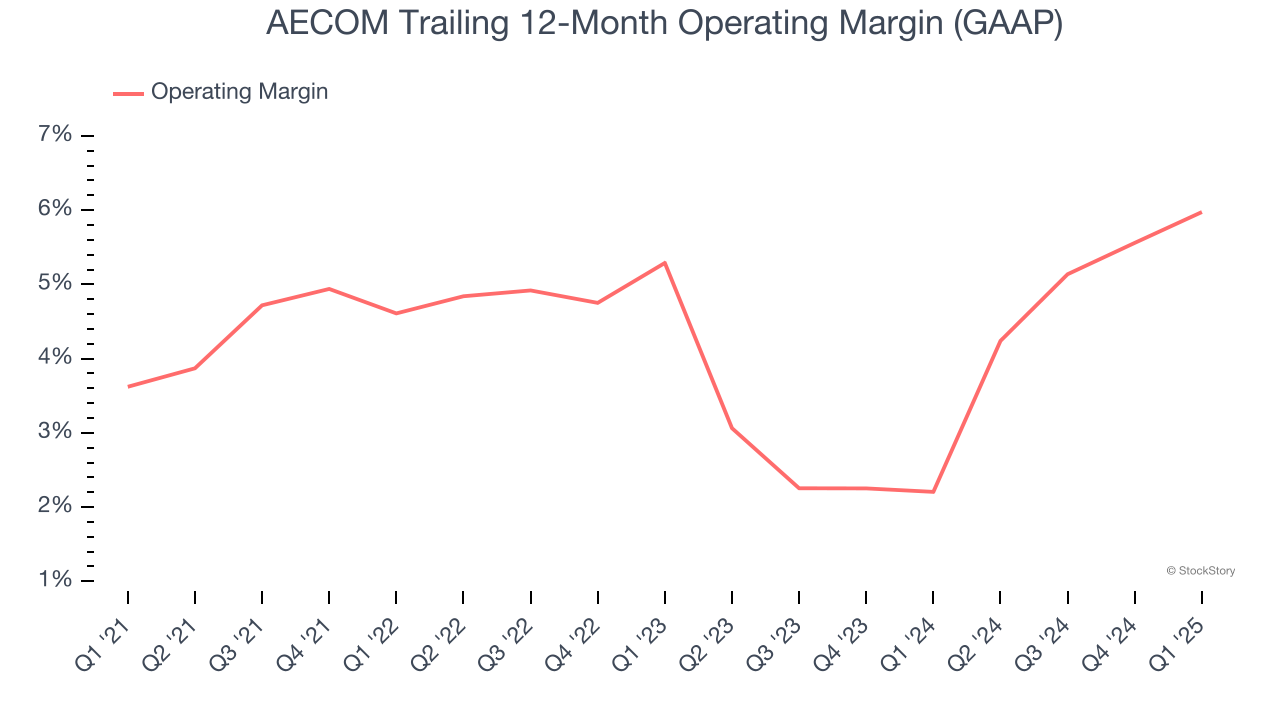
This quarter, AECOM generated an operating profit margin of 6.8%, up 1.7 percentage points year on year. The increase was encouraging, and because its operating margin rose more than its gross margin, we can infer it was more efficient with expenses such as marketing, R&D, and administrative overhead.
Earnings Per Share
Revenue trends explain a company’s historical growth, but the long-term change in earnings per share (EPS) points to the profitability of that growth – for example, a company could inflate its sales through excessive spending on advertising and promotions.
AECOM’s EPS grew at an astounding 19% compounded annual growth rate over the last five years, higher than its 3.7% annualized revenue growth. This tells us the company became more profitable on a per-share basis as it expanded.
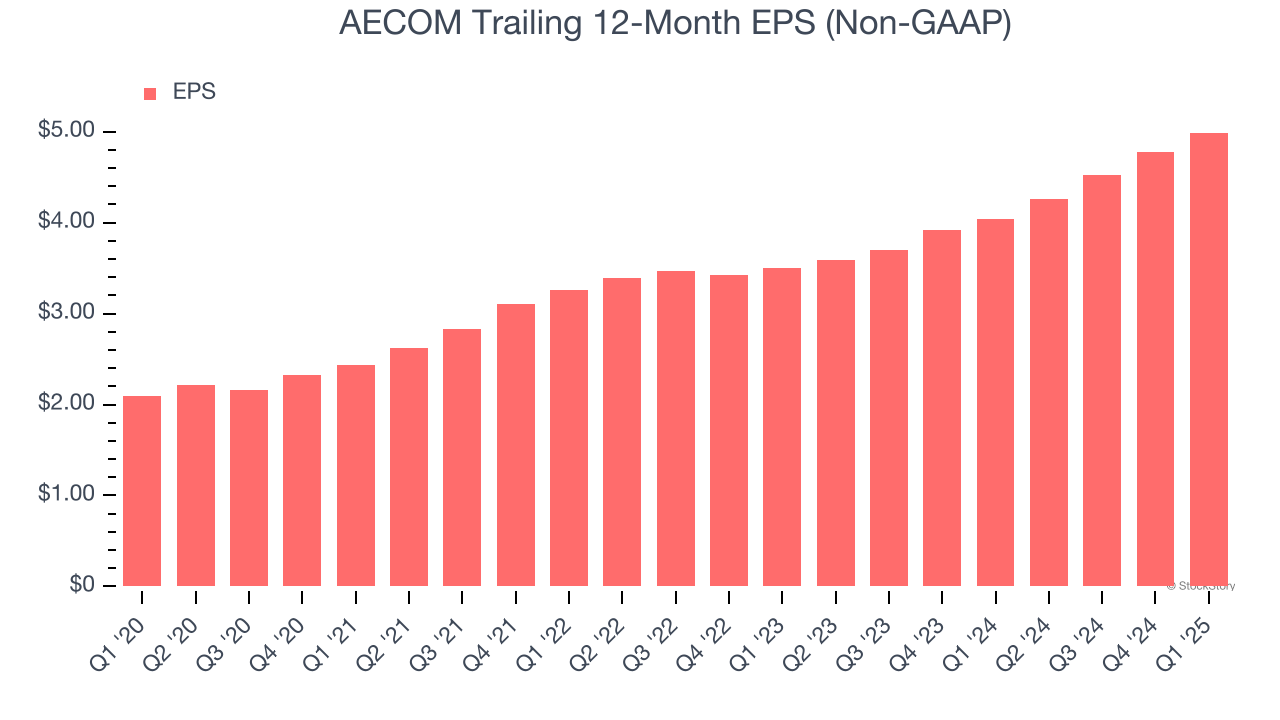
Diving into AECOM’s quality of earnings can give us a better understanding of its performance. As we mentioned earlier, AECOM’s operating margin expanded by 2.4 percentage points over the last five years. On top of that, its share count shrank by 17.2%. These are positive signs for shareholders because improving profitability and share buybacks turbocharge EPS growth relative to revenue growth. 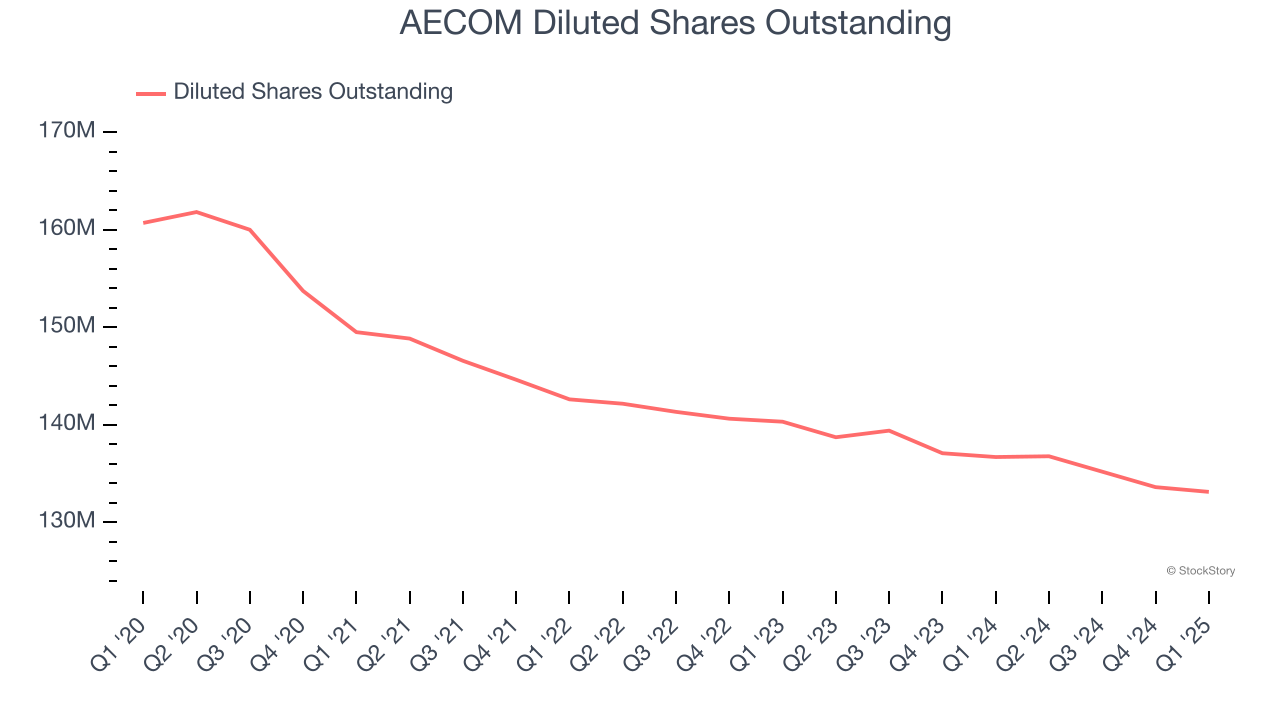
Like with revenue, we analyze EPS over a more recent period because it can provide insight into an emerging theme or development for the business.
For AECOM, its two-year annual EPS growth of 19.3% is similar to its five-year trend, implying strong and stable earnings power.
In Q1, AECOM reported EPS at $1.25, up from $1.04 in the same quarter last year. This print beat analysts’ estimates by 4.8%. Over the next 12 months, Wall Street expects AECOM’s full-year EPS of $4.99 to grow 2.9%.
Key Takeaways from AECOM’s Q1 Results
It was encouraging to see AECOM beat analysts’ EPS expectations this quarter. We were also happy its EBITDA narrowly outperformed Wall Street’s estimates. On the other hand, its revenue missed significantly. Overall, this quarter was mixed. The stock remained flat at $103 immediately after reporting.
Is AECOM an attractive investment opportunity at the current price? When making that decision, it’s important to consider its valuation, business qualities, as well as what has happened in the latest quarter. We cover that in our actionable full research report which you can read here, it’s free.
More News
View More


Recent Quotes
View More
Quotes delayed at least 20 minutes.
By accessing this page, you agree to the Privacy Policy and Terms Of Service.