WSFS Financial’s (NASDAQ:WSFS) Q2 Sales Top Estimates

Regional banking company WSFS Financial (NASDAQ: WSFS) beat Wall Street’s revenue expectations in Q2 CY2025, but sales were flat year on year at $267.5 million. Its GAAP profit of $1.27 per share was 12.1% above analysts’ consensus estimates.
Is now the time to buy WSFS Financial? Find out by accessing our full research report, it’s free.
WSFS Financial (WSFS) Q2 CY2025 Highlights:
- Net Interest Income: $179.5 million vs analyst estimates of $177.2 million (2.9% year-on-year growth, 1.3% beat)
- Net Interest Margin: 3.9% vs analyst estimates of 3.9% (4 basis point year-on-year increase, in line)
- Revenue: $267.5 million vs analyst estimates of $264.4 million (flat year on year, 1.2% beat)
- Efficiency Ratio: 59.5% vs analyst estimates of 60.8% (1.3 percentage point beat)
- EPS (GAAP): $1.27 vs analyst estimates of $1.13 (12.1% beat)
- Market Capitalization: $3.30 billion
Company Overview
Founded in 1832 as Wilmington Savings Fund Society and one of the oldest banks in America still operating under its original name, WSFS Financial (NASDAQ: WSFS) operates a community banking and wealth management franchise primarily serving customers in the Mid-Atlantic region through its main subsidiary, WSFS Bank.
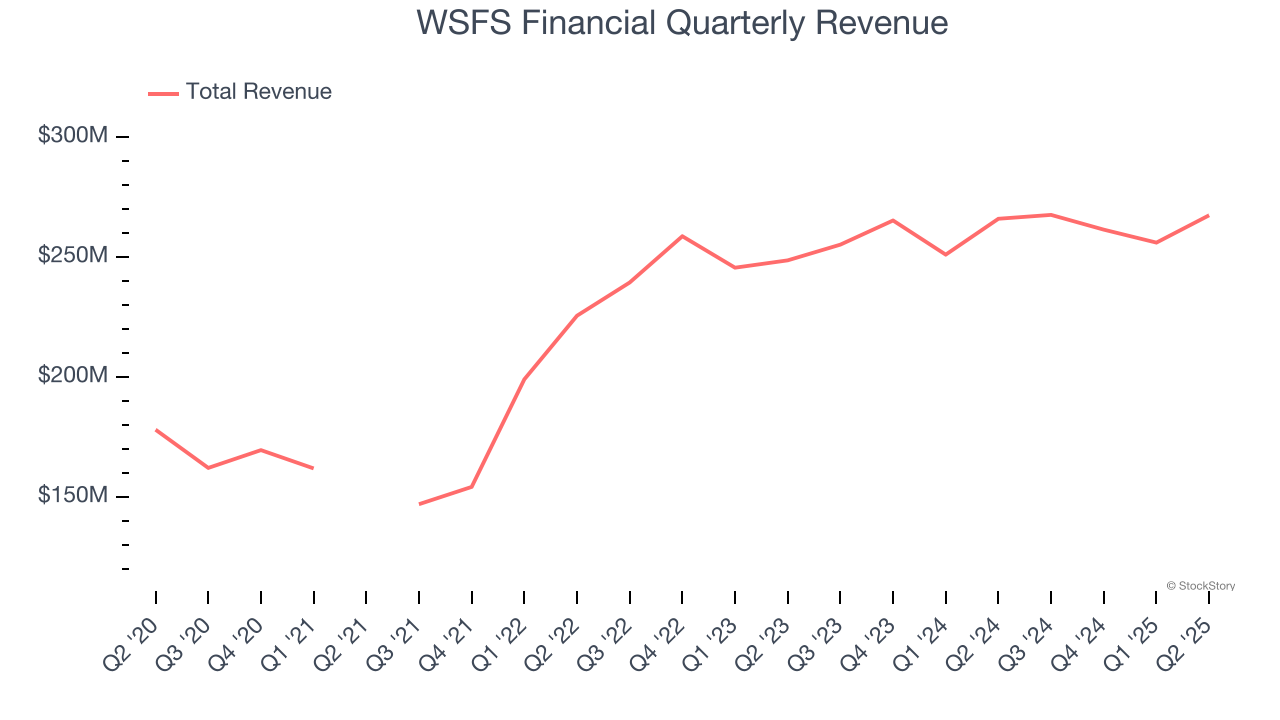
Sales Growth
Net interest income and and fee-based revenue are the two pillars supporting bank earnings. The former captures profit from the gap between lending rates and deposit costs, while the latter encompasses charges for banking services, credit products, wealth management, and trading activities.
Thankfully, WSFS Financial’s 9.2% annualized revenue growth over the last five years was impressive. Its growth beat the average bank company and shows its offerings resonate with customers, a helpful starting point for our analysis.
 Note: Quarters not shown were determined to be outliers, impacted by outsized investment gains/losses that are not indicative of the recurring fundamentals of the business.
Long-term growth is the most important, but within financials, a half-decade historical view may miss recent interest rate changes and market returns. WSFS Financial’s recent performance shows its demand has slowed significantly as its annualized revenue growth of 3% over the last two years was well below its five-year trend. 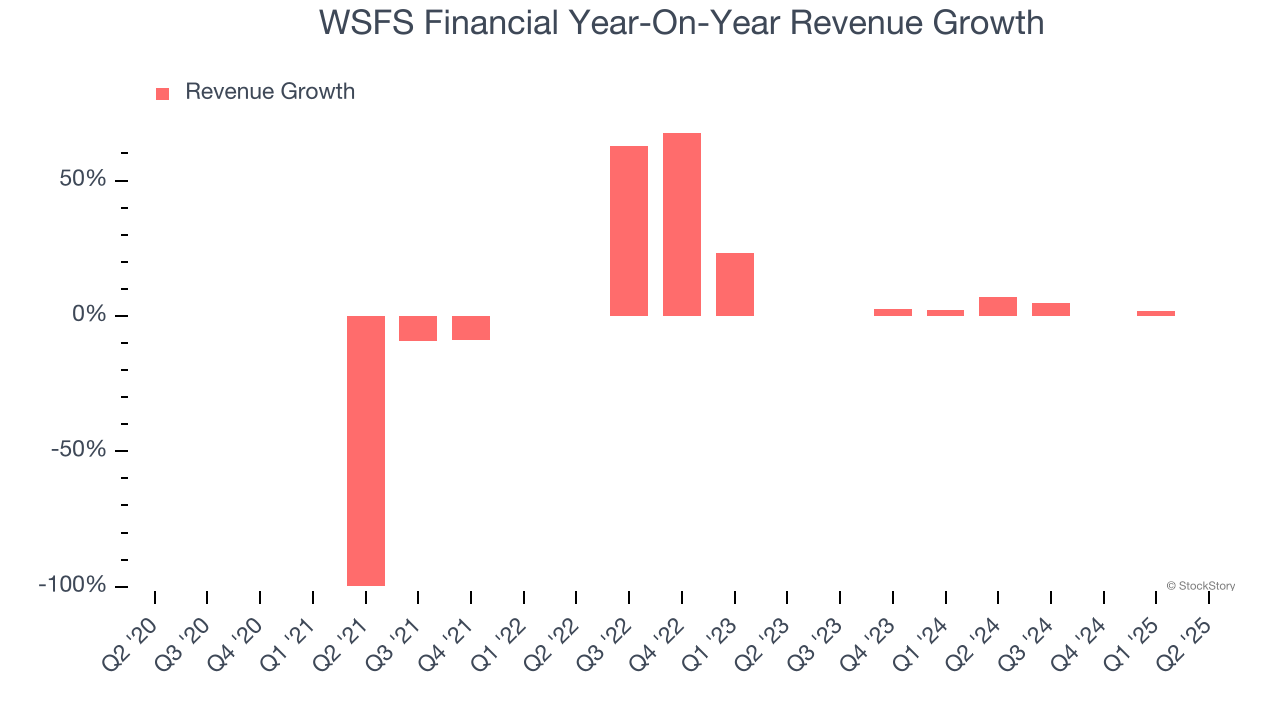 Note: Quarters not shown were determined to be outliers, impacted by outsized investment gains/losses that are not indicative of the recurring fundamentals of the business.
This quarter, WSFS Financial’s $267.5 million of revenue was flat year on year but beat Wall Street’s estimates by 1.2%.
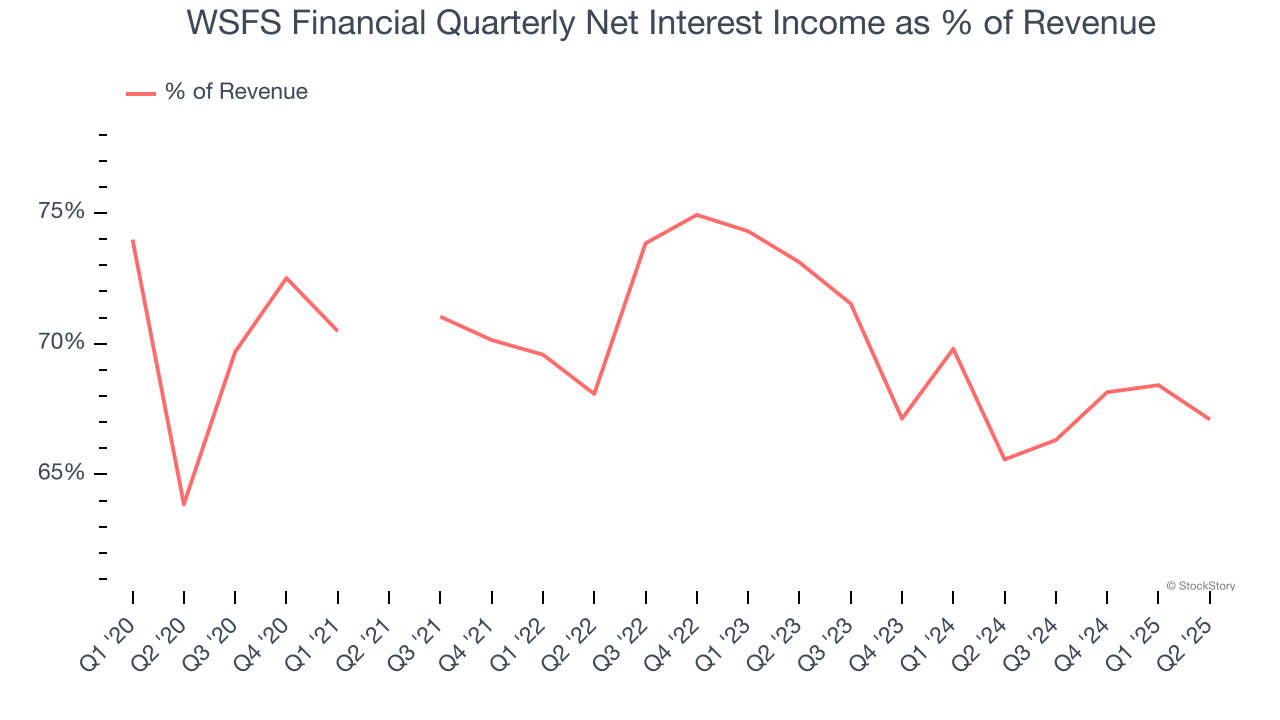
Since the company recorded losses on certain securities, it generated more net interest income than revenue (a 34.9x multiple of its revenue to be exact) during the last five years, meaning WSFS Financial lives and dies by its lending activities because non-interest income barely moves the needle.
 Note: Quarters not shown were determined to be outliers, impacted by outsized investment gains/losses that are not indicative of the recurring fundamentals of the business.
Our experience and research show the market cares primarily about a bank’s net interest income growth as non-interest income is considered a lower-quality and non-recurring revenue source.
Here at StockStory, we certainly understand the potential of thematic investing. Diverse winners from Microsoft (MSFT) to Alphabet (GOOG), Coca-Cola (KO) to Monster Beverage (MNST) could all have been identified as promising growth stories with a megatrend driving the growth. So, in that spirit, we’ve identified a relatively under-the-radar profitable growth stock benefiting from the rise of AI, available to you FREE via this link.
Net Interest Income
WSFS Financial’s net interest income has grown at a 9.1% annualized rate over the last five years, slightly better than the broader bank industry and in line with its total revenue.
When analyzing WSFS Financial’s net interest income over the last two years, we can see it did a 180 as income dropped by 1.7% annually. This was partly driven by its overall lending exposure, which fell from $428.8 million to $281.7 million.
Loan originations are one factor, but what matters more is the risk and profitability of those loans. Specifically, we can see the company’s net interest margin averaged an impressive 3.9% over the past two years. However, its margin contracted by 26.7 basis points (100 basis points = 1 percentage point) over that period.
This decline was a headwind for its net interest income. While prevailing rates are a major determinant of net interest margin changes over time, the decline could mean WSFS Financial either faced competition for loans and deposits or experienced a negative mix shift in its balance sheet composition. One caveat is that net interest margins can also decrease to reflect lower default risk if banks begin making more conservative loans.
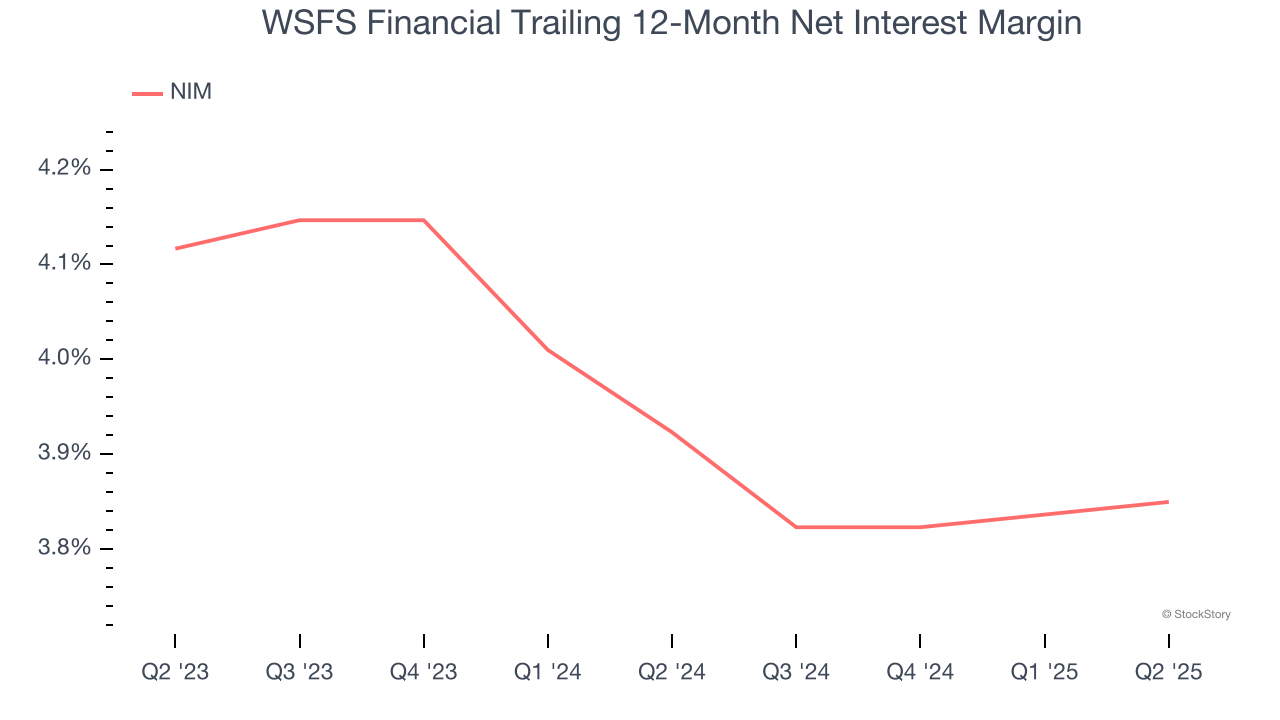
In Q2, WSFS Financial produced $179.5 million of net interest income, up 2.9% year on year and topping Wall Street Consensus estimates by 1.3%. Net interest margin was 3.9%, meeting sell-side expectations.
Looking ahead, sell-side analysts expect net interest income to grow 1.1% over the next 12 months.
Key Takeaways from WSFS Financial’s Q2 Results
It was encouraging to see WSFS Financial beat analysts’ EPS expectations this quarter. We were also happy its net interest income narrowly outperformed Wall Street’s estimates. Overall, we think this was a solid quarter with some key areas of upside. The stock remained flat at $56.61 immediately after reporting.
Indeed, WSFS Financial had a rock-solid quarterly earnings result, but is this stock a good investment here? If you’re making that decision, you should consider the bigger picture of valuation, business qualities, as well as the latest earnings. We cover that in our actionable full research report which you can read here, it’s free.
More News
View More


Recent Quotes
View More
Quotes delayed at least 20 minutes.
By accessing this page, you agree to the Privacy Policy and Terms Of Service.