Titan International (NYSE:TWI) Misses Q2 Revenue Estimates, Stock Drops

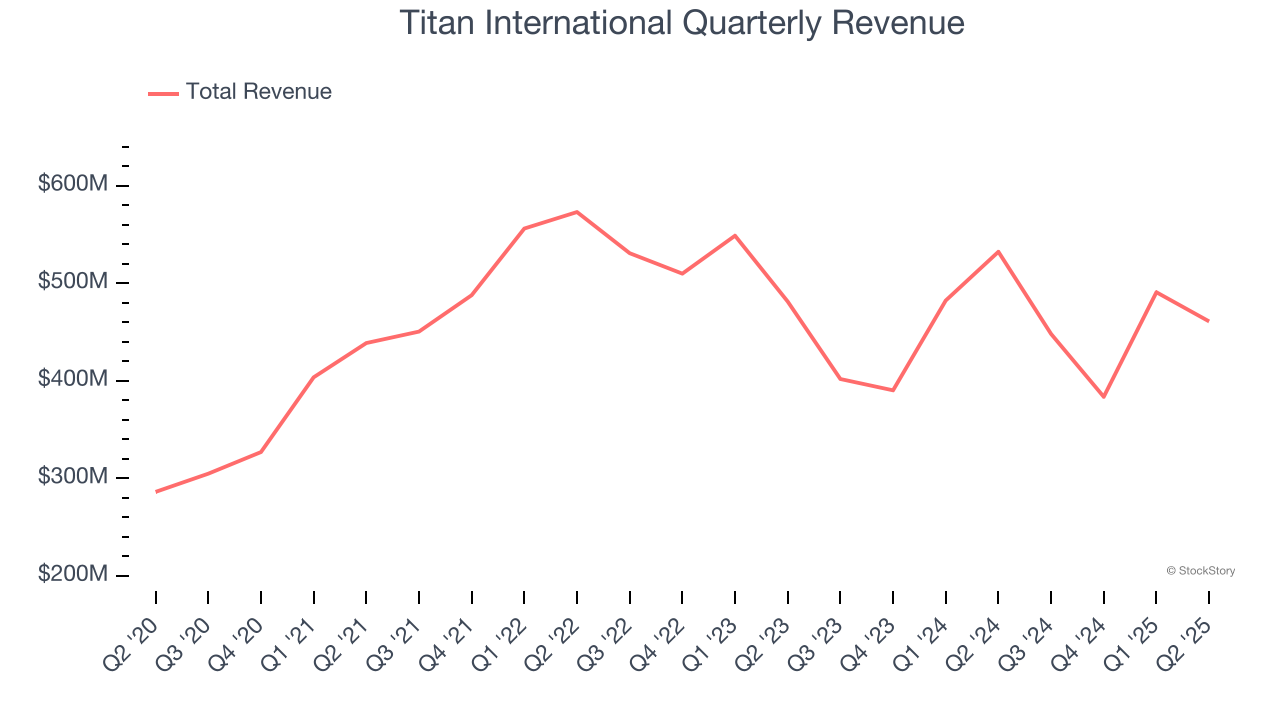
Agricultural and farm machinery company Titan (NSYE:TWI) fell short of the market’s revenue expectations in Q2 CY2025, with sales falling 13.4% year on year to $460.8 million. On the other hand, the company expects next quarter’s revenue to be around $462.5 million, close to analysts’ estimates. Its GAAP loss of $0.07 per share was significantly below analysts’ consensus estimates.
Is now the time to buy Titan International? Find out by accessing our full research report, it’s free.
Titan International (TWI) Q2 CY2025 Highlights:
- Revenue: $460.8 million vs analyst estimates of $478 million (13.4% year-on-year decline, 3.6% miss)
- EPS (GAAP): -$0.07 vs analyst estimates of $0.01 (significant miss)
- Adjusted EBITDA: $30.16 million vs analyst estimates of $28.61 million (6.5% margin, 5.4% beat)
- Revenue Guidance for Q3 CY2025 is $462.5 million at the midpoint, roughly in line with what analysts were expecting
- EBITDA guidance for Q3 CY2025 is $27.5 million at the midpoint, below analyst estimates of $28.34 million
- Operating Margin: 2.2%, down from 4.3% in the same quarter last year
- Free Cash Flow Margin: 0.9%, down from 10% in the same quarter last year
- Market Capitalization: $577.8 million
Company Overview
Acquiring Goodyear’s farm tire business in 2005, Titan (NSYE:TWI) is a manufacturer and supplier of wheels, tires, and undercarriages used in off-highway vehicles such as construction vehicles.
Revenue Growth
A company’s long-term sales performance can indicate its overall quality. Even a bad business can shine for one or two quarters, but a top-tier one grows for years. Over the last five years, Titan International grew its sales at a mediocre 6.9% compounded annual growth rate. This was below our standard for the industrials sector and is a tough starting point for our analysis.
We at StockStory place the most emphasis on long-term growth, but within industrials, a half-decade historical view may miss cycles, industry trends, or a company capitalizing on catalysts such as a new contract win or a successful product line. Titan International’s performance shows it grew in the past but relinquished its gains over the last two years, as its revenue fell by 7.2% annually. Titan International isn’t alone in its struggles as the Agricultural Machinery industry experienced a cyclical downturn, with many similar businesses observing lower sales at this time. 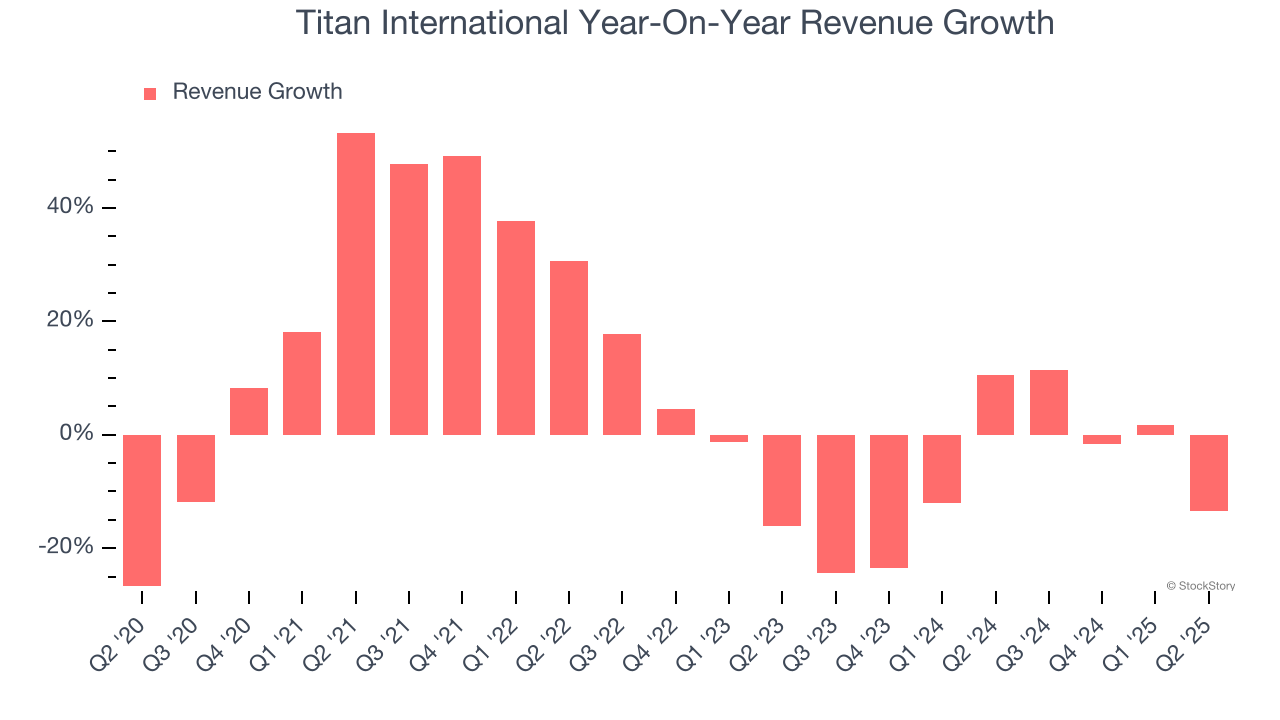
This quarter, Titan International missed Wall Street’s estimates and reported a rather uninspiring 13.4% year-on-year revenue decline, generating $460.8 million of revenue. Company management is currently guiding for a 3.2% year-on-year increase in sales next quarter.
Looking further ahead, sell-side analysts expect revenue to grow 7.5% over the next 12 months, an improvement versus the last two years. This projection is above the sector average and suggests its newer products and services will catalyze better top-line performance.
Here at StockStory, we certainly understand the potential of thematic investing. Diverse winners from Microsoft (MSFT) to Alphabet (GOOG), Coca-Cola (KO) to Monster Beverage (MNST) could all have been identified as promising growth stories with a megatrend driving the growth. So, in that spirit, we’ve identified a relatively under-the-radar profitable growth stock benefiting from the rise of AI, available to you FREE via this link.
Operating Margin
Titan International was profitable over the last five years but held back by its large cost base. Its average operating margin of 5.4% was weak for an industrials business. This result isn’t too surprising given its low gross margin as a starting point.
Analyzing the trend in its profitability, Titan International’s operating margin decreased by 2.6 percentage points over the last five years. This raises questions about the company’s expense base because its revenue growth should have given it leverage on its fixed costs, resulting in better economies of scale and profitability. Titan International’s performance was poor no matter how you look at it - it shows that costs were rising and it couldn’t pass them onto its customers.
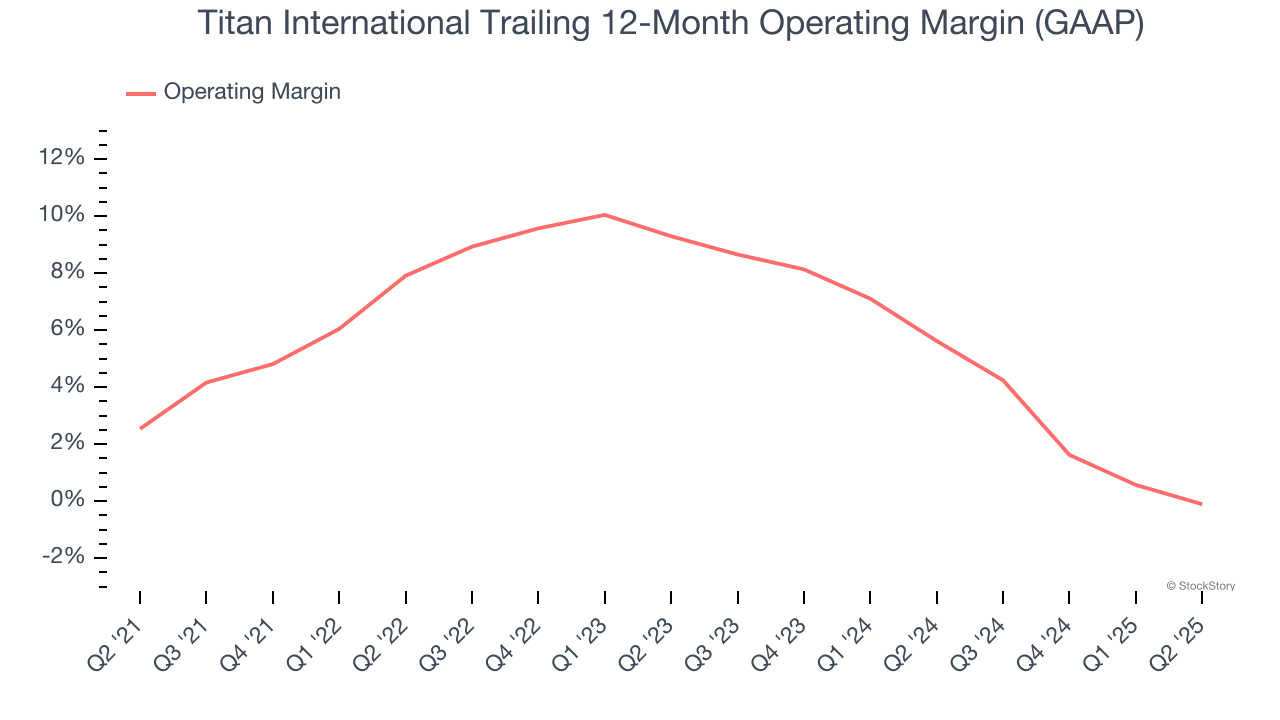
In Q2, Titan International generated an operating margin profit margin of 2.2%, down 2 percentage points year on year. Since Titan International’s operating margin decreased more than its gross margin, we can assume it was less efficient because expenses such as marketing, R&D, and administrative overhead increased.
Earnings Per Share
Revenue trends explain a company’s historical growth, but the long-term change in earnings per share (EPS) points to the profitability of that growth – for example, a company could inflate its sales through excessive spending on advertising and promotions.
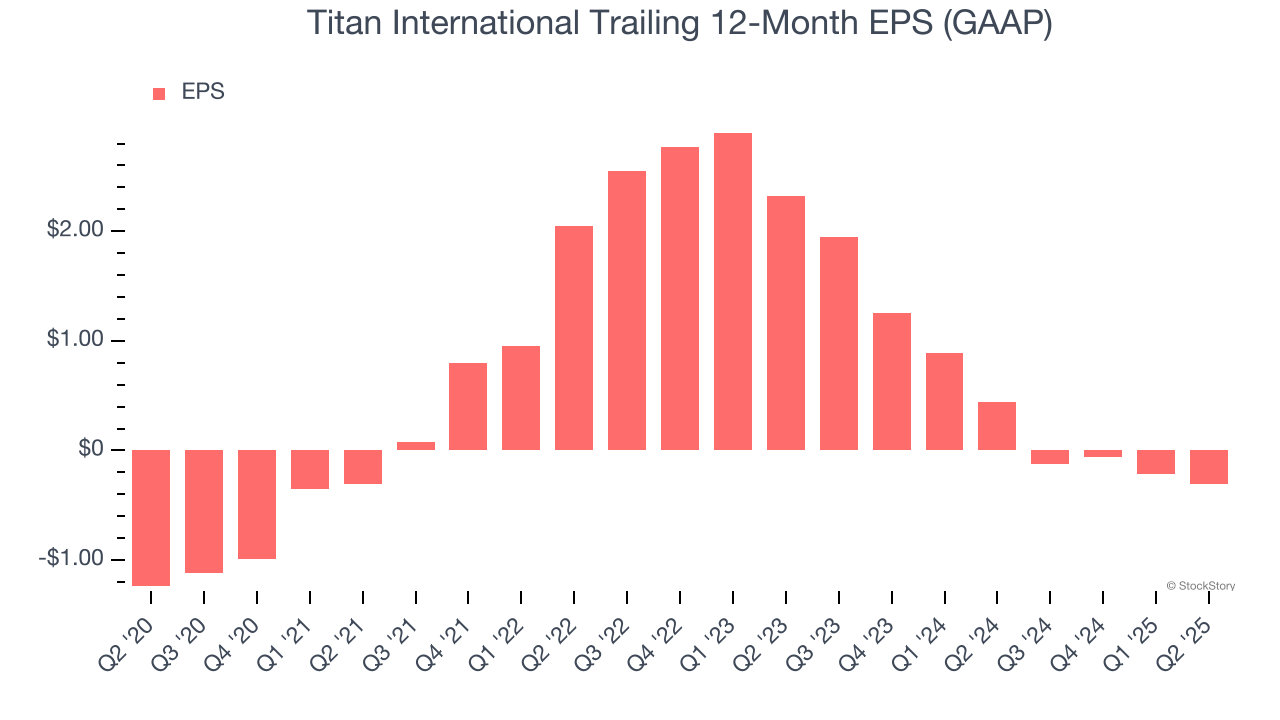
Although Titan International’s full-year earnings are still negative, it reduced its losses and improved its EPS by 24.2% annually over the last five years. The next few quarters will be critical for assessing its long-term profitability.
Like with revenue, we analyze EPS over a shorter period to see if we are missing a change in the business.
Sadly for Titan International, its EPS declined by more than its revenue over the last two years, dropping 46.1%. This tells us the company struggled to adjust to shrinking demand.
We can take a deeper look into Titan International’s earnings to better understand the drivers of its performance. Titan International’s operating margin has declined by 7.3 percentage points over the last two years. This was the most relevant factor (aside from the revenue impact) behind its lower earnings; interest expenses and taxes can also affect EPS but don’t tell us as much about a company’s fundamentals.
In Q2, Titan International reported EPS at negative $0.07, down from $0.03 in the same quarter last year. This print missed analysts’ estimates. Over the next 12 months, Wall Street is optimistic. Analysts forecast Titan International’s full-year EPS of negative $0.31 will reach break even.
Key Takeaways from Titan International’s Q2 Results
We enjoyed seeing Titan International beat analysts’ EBITDA expectations this quarter. On the other hand, its revenue missed and its EPS fell short of Wall Street’s estimates. Overall, this was a softer quarter. The stock traded down 10% to $8.18 immediately after reporting.
Titan International’s earnings report left more to be desired. Let’s look forward to see if this quarter has created an opportunity to buy the stock. When making that decision, it’s important to consider its valuation, business qualities, as well as what has happened in the latest quarter. We cover that in our actionable full research report which you can read here, it’s free.
More News
View More


Recent Quotes
View More
Quotes delayed at least 20 minutes.
By accessing this page, you agree to the Privacy Policy and Terms Of Service.