Malibu Boats (NASDAQ:MBUU) Posts Better-Than-Expected Sales In Q2 But Stock Drops

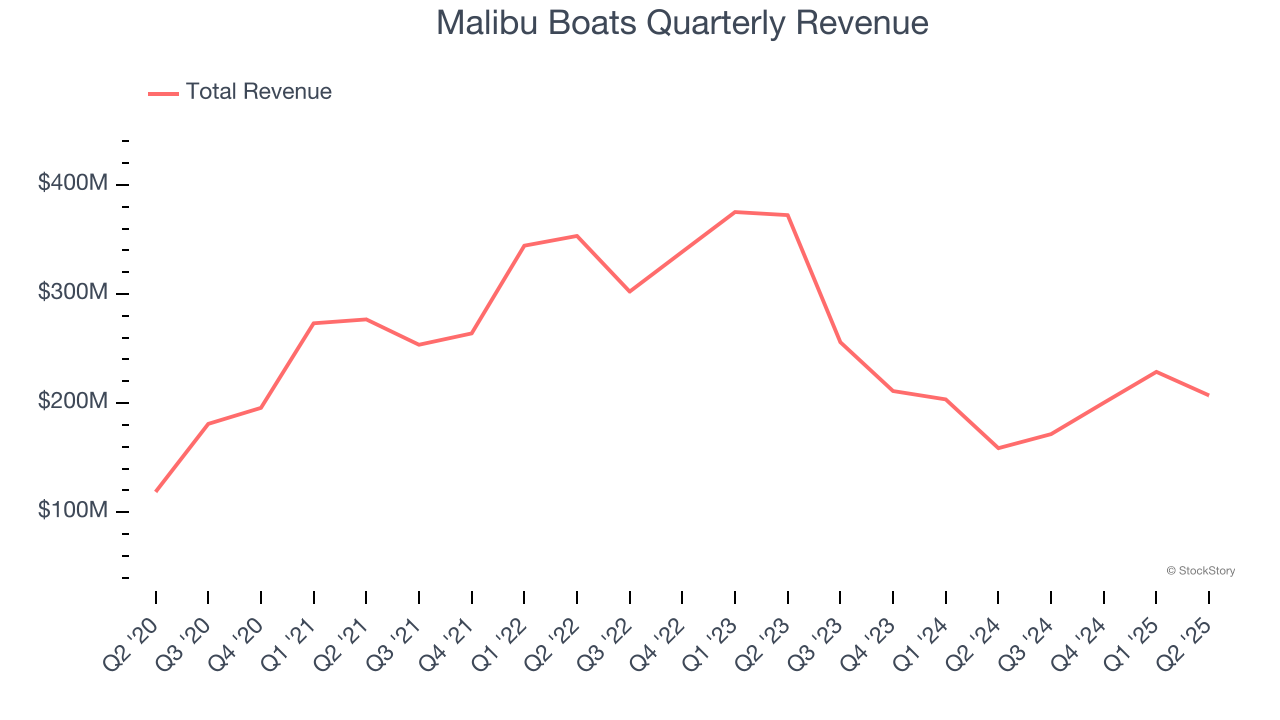
Recreational boats manufacturer Malibu Boats (NASDAQ: MBUU) reported revenue ahead of Wall Street’s expectations in Q2 CY2025, with sales up 30.4% year on year to $207 million. Its non-GAAP profit of $0.42 per share was 9.4% below analysts’ consensus estimates.
Is now the time to buy Malibu Boats? Find out by accessing our full research report, it’s free.
Malibu Boats (MBUU) Q2 CY2025 Highlights:
- Revenue: $207 million vs analyst estimates of $196.4 million (30.4% year-on-year growth, 5.4% beat)
- Adjusted EPS: $0.42 vs analyst expectations of $0.46 (9.4% miss)
- Adjusted EBITDA: $19.66 million vs analyst estimates of $21.32 million (9.5% margin, 7.8% miss)
- Operating Margin: 3.3%, up from -15.4% in the same quarter last year
- Market Capitalization: $758.4 million
Company Overview
Founded in California in 1982, Malibu Boats (NASDAQ: MBUU) is a manufacturer of high-performance sports boats and luxury watercrafts.
Revenue Growth
A company’s long-term sales performance can indicate its overall quality. Any business can put up a good quarter or two, but many enduring ones grow for years. Unfortunately, Malibu Boats’s 4.3% annualized revenue growth over the last five years was sluggish. This was below our standard for the consumer discretionary sector and is a tough starting point for our analysis.
We at StockStory place the most emphasis on long-term growth, but within consumer discretionary, a stretched historical view may miss a company riding a successful new product or trend. Malibu Boats’s performance shows it grew in the past but relinquished its gains over the last two years, as its revenue fell by 23.7% annually. 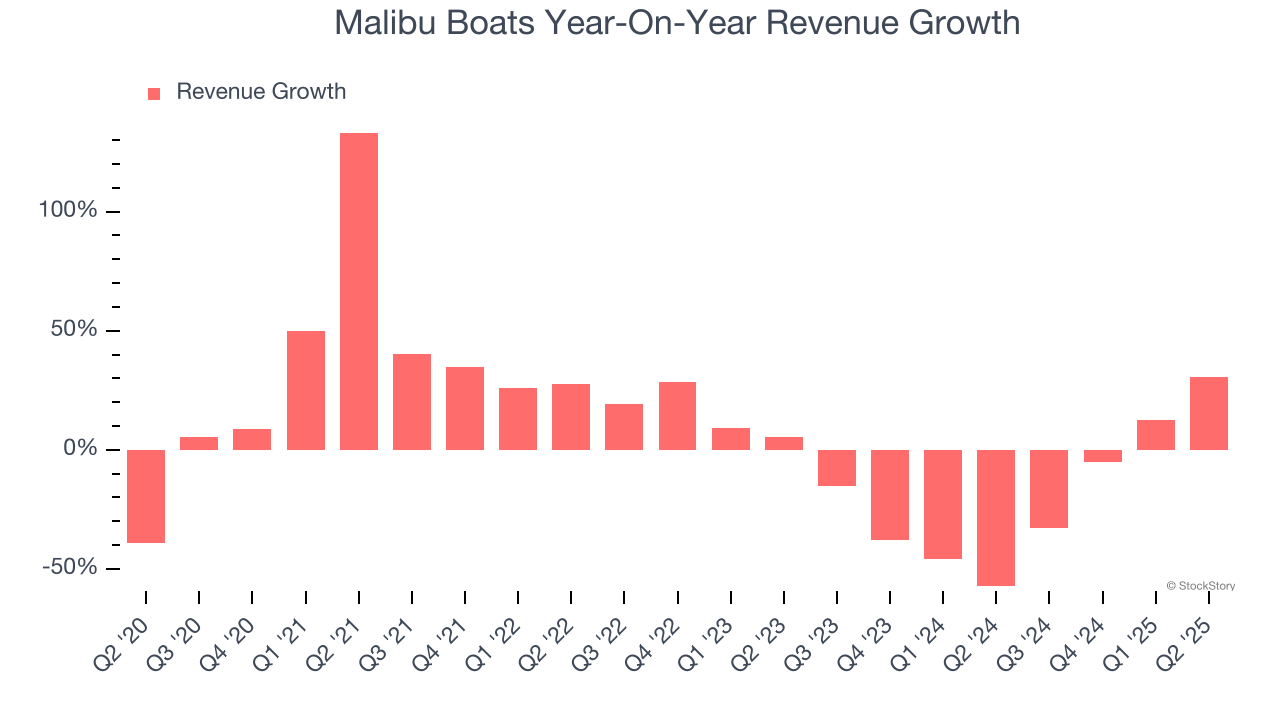
This quarter, Malibu Boats reported wonderful year-on-year revenue growth of 30.4%, and its $207 million of revenue exceeded Wall Street’s estimates by 5.4%.
Looking ahead, sell-side analysts expect revenue to grow 9.4% over the next 12 months. While this projection indicates its newer products and services will catalyze better top-line performance, it is still below average for the sector.
Software is eating the world and there is virtually no industry left that has been untouched by it. That drives increasing demand for tools helping software developers do their jobs, whether it be monitoring critical cloud infrastructure, integrating audio and video functionality, or ensuring smooth content streaming. Click here to access a free report on our 3 favorite stocks to play this generational megatrend.
Operating Margin
Operating margin is a key measure of profitability. Think of it as net income - the bottom line - excluding the impact of taxes and interest on debt, which are less connected to business fundamentals.
Malibu Boats’s operating margin has been trending up over the last 12 months, but it still averaged negative 2.1% over the last two years. This is due to its large expense base and inefficient cost structure.
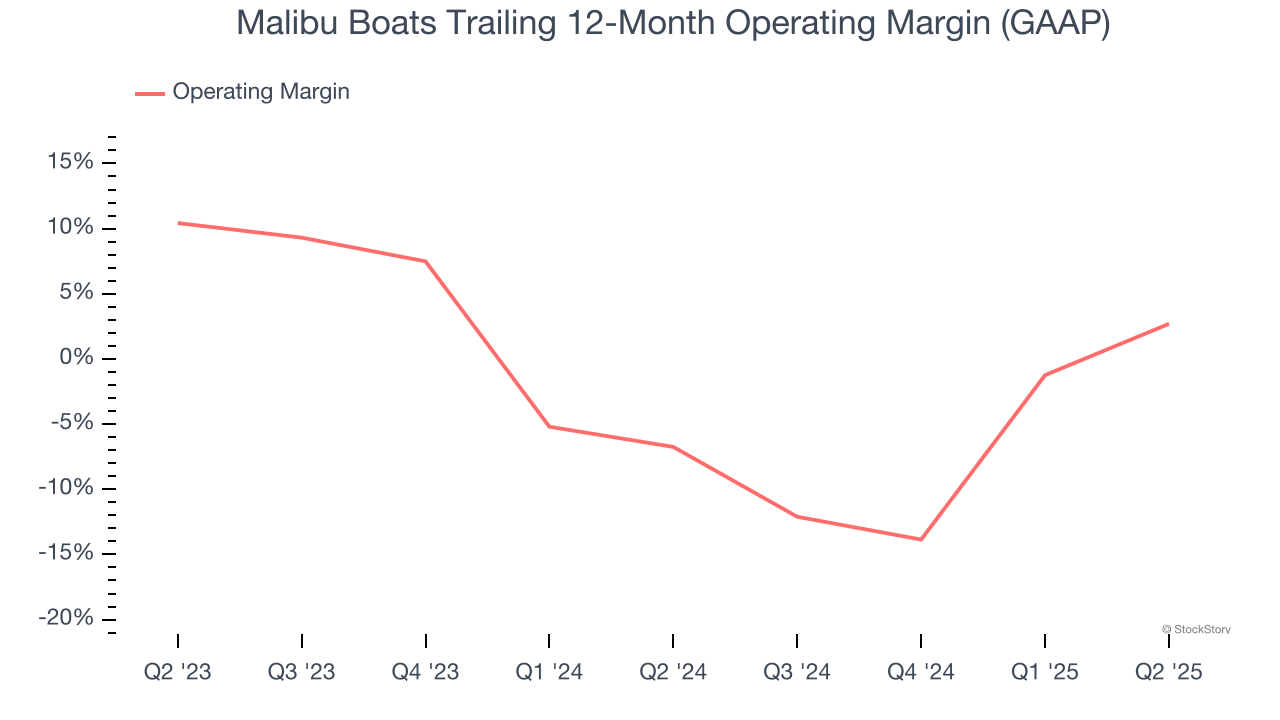
In Q2, Malibu Boats generated an operating margin profit margin of 3.3%, up 18.7 percentage points year on year. This increase was a welcome development and shows it was more efficient.
Earnings Per Share
We track the long-term change in earnings per share (EPS) for the same reason as long-term revenue growth. Compared to revenue, however, EPS highlights whether a company’s growth is profitable.
Sadly for Malibu Boats, its EPS declined by 14.2% annually over the last five years while its revenue grew by 4.3%. This tells us the company became less profitable on a per-share basis as it expanded due to non-fundamental factors such as interest expenses and taxes.
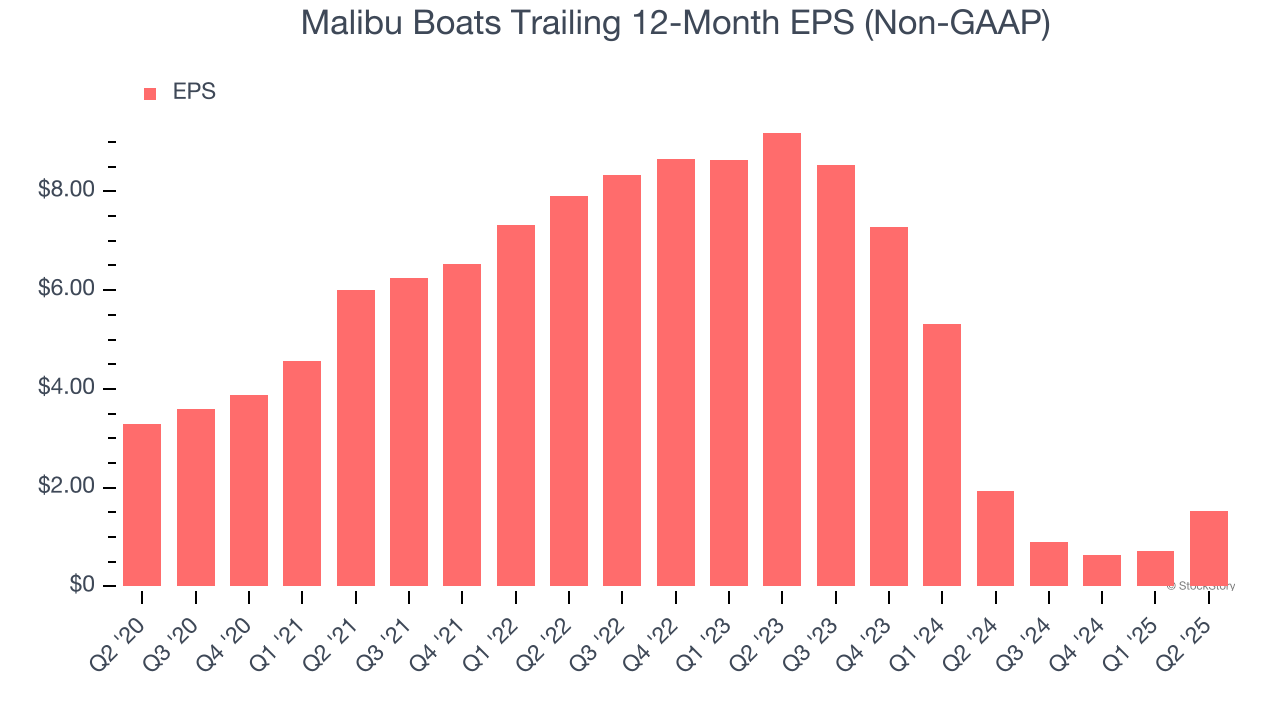
In Q2, Malibu Boats reported adjusted EPS of $0.42, up from negative $0.39 in the same quarter last year. Despite growing year on year, this print missed analysts’ estimates. Over the next 12 months, Wall Street expects Malibu Boats’s full-year EPS of $1.53 to grow 70.3%.
Key Takeaways from Malibu Boats’s Q2 Results
We enjoyed seeing Malibu Boats beat analysts’ revenue expectations this quarter. On the other hand, its EPS missed and its EBITDA fell short of Wall Street’s estimates. Overall, this was a softer quarter. The stock traded down 7.2% to $36.72 immediately after reporting.
The latest quarter from Malibu Boats’s wasn’t that good. One earnings report doesn’t define a company’s quality, though, so let’s explore whether the stock is a buy at the current price. The latest quarter does matter, but not nearly as much as longer-term fundamentals and valuation, when deciding if the stock is a buy. We cover that in our actionable full research report which you can read here, it’s free.
More News
View More


Recent Quotes
View More
Quotes delayed at least 20 minutes.
By accessing this page, you agree to the Privacy Policy and Terms Of Service.