Allient’s (NASDAQ:ALNT) Q2: Strong Sales, Stock Jumps 18.9%

Precision motion systems specialist Allient (NASDAQ: ALNT) reported revenue ahead of Wall Street’s expectations in Q2 CY2025, with sales up 2.6% year on year to $139.6 million. Its non-GAAP profit of $0.57 per share was 20.4% above analysts’ consensus estimates.
Is now the time to buy Allient? Find out by accessing our full research report, it’s free.
Allient (ALNT) Q2 CY2025 Highlights:
- Revenue: $139.6 million vs analyst estimates of $132.9 million (2.6% year-on-year growth, 5% beat)
- Adjusted EPS: $0.57 vs analyst estimates of $0.47 (20.4% beat)
- Adjusted EBITDA: $20.07 million vs analyst estimates of $17.19 million (14.4% margin, 16.7% beat)
- Operating Margin: 8.4%, up from 4.7% in the same quarter last year
- Free Cash Flow Margin: 16%, up from 4.3% in the same quarter last year
- Backlog: $236.6 million at quarter end
- Market Capitalization: $679 million
“This quarter clearly reflects the momentum we are building through focused execution and market alignment. Our Simplify to Accelerate NOW program continues to drive meaningful results, as a high-margin mix, improved volumes, and strong operational discipline contributed to our highest gross margin performance to date. This translated into significant operating leverage and a strong increase in profitability,” commented Dick Warzala, Chairman and CEO.
Company Overview
Founded in 1962, Allient (NASDAQ: ALNT) develops and manufactures precision and specialty-controlled motion components and systems.
Revenue Growth
A company’s long-term performance is an indicator of its overall quality. Any business can put up a good quarter or two, but many enduring ones grow for years. Unfortunately, Allient’s 7.4% annualized revenue growth over the last five years was mediocre. This was below our standard for the industrials sector and is a tough starting point for our analysis.
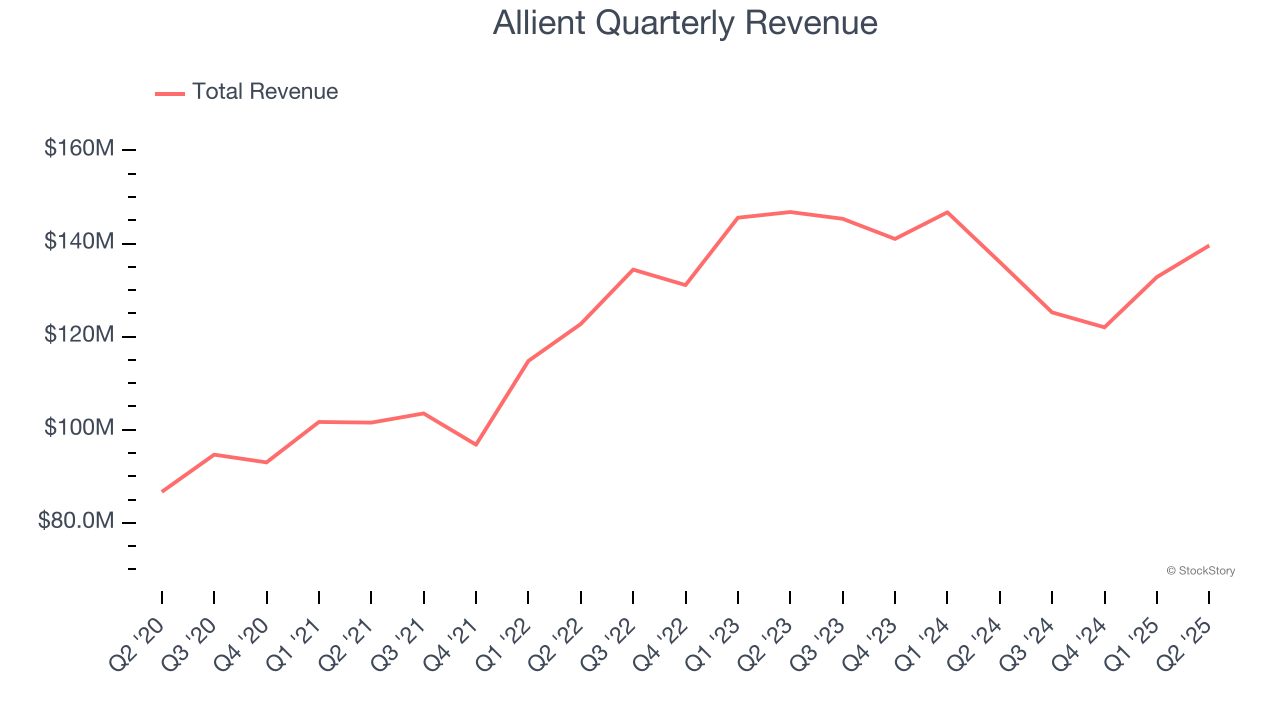
We at StockStory place the most emphasis on long-term growth, but within industrials, a half-decade historical view may miss cycles, industry trends, or a company capitalizing on catalysts such as a new contract win or a successful product line. Allient’s performance shows it grew in the past but relinquished its gains over the last two years, as its revenue fell by 3.5% annually. Allient isn’t alone in its struggles as the Electronic Components industry experienced a cyclical downturn, with many similar businesses observing lower sales at this time. 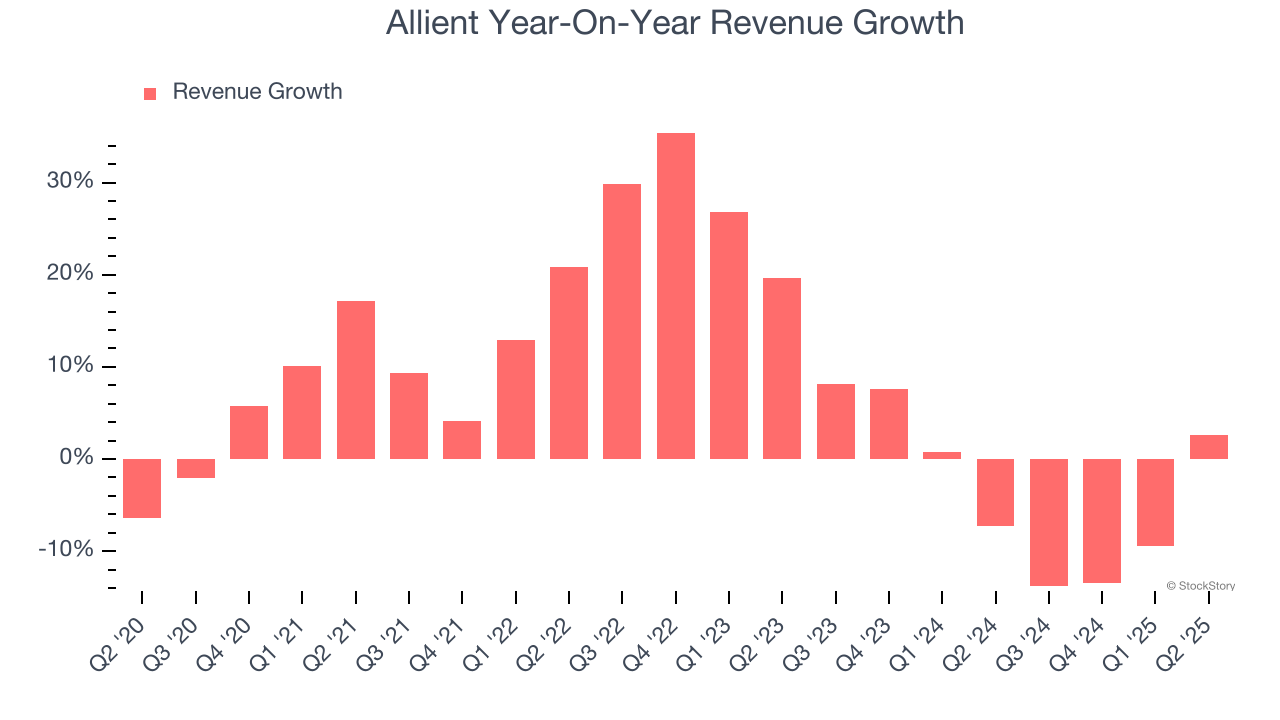
This quarter, Allient reported modest year-on-year revenue growth of 2.6% but beat Wall Street’s estimates by 5%.
Looking ahead, sell-side analysts expect revenue to grow 5.3% over the next 12 months. Although this projection implies its newer products and services will catalyze better top-line performance, it is still below the sector average.
Unless you’ve been living under a rock, it should be obvious by now that generative AI is going to have a huge impact on how large corporations do business. While Nvidia and AMD are trading close to all-time highs, we prefer a lesser-known (but still profitable) stock benefiting from the rise of AI. Click here to access our free report one of our favorites growth stories.
Operating Margin
Allient’s operating margin might fluctuated slightly over the last 12 months but has remained more or less the same, averaging 6.7% over the last five years. This profitability was mediocre for an industrials business and caused by its suboptimal cost structure.
Analyzing the trend in its profitability, Allient’s operating margin might fluctuated slightly but has generally stayed the same over the last five years. This raises questions about the company’s expense base because its revenue growth should have given it leverage on its fixed costs, resulting in better economies of scale and profitability.
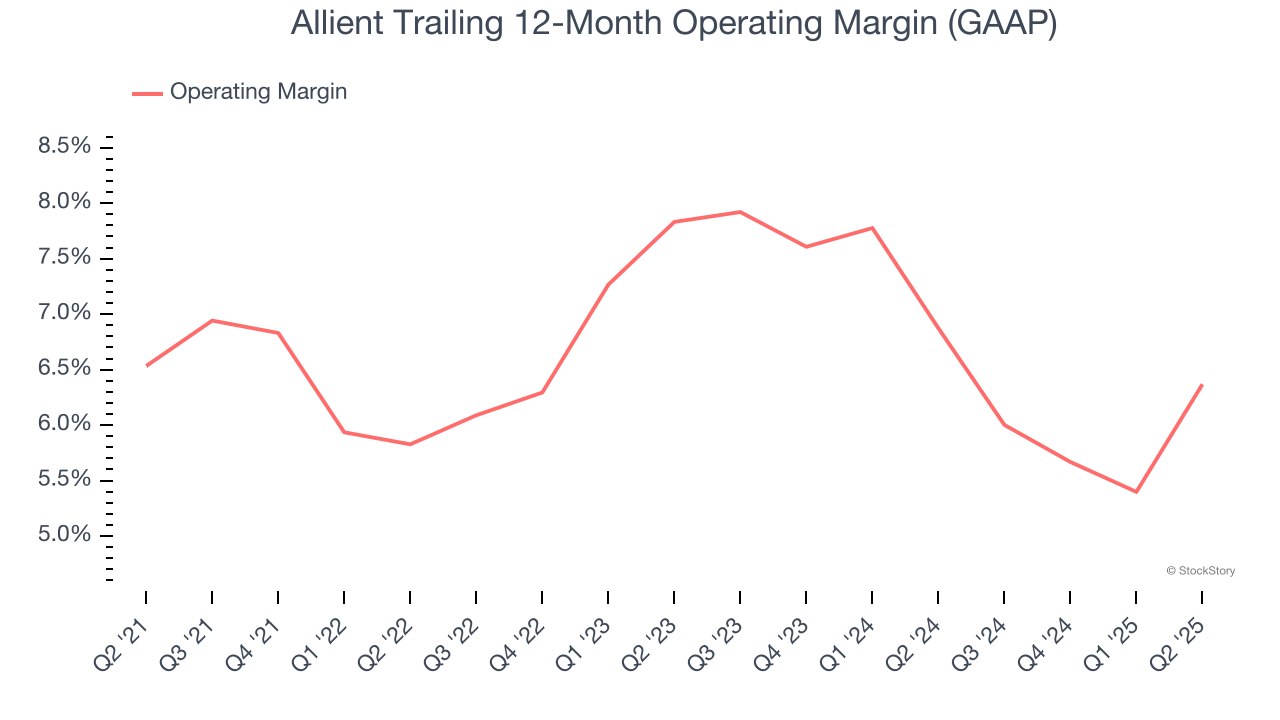
This quarter, Allient generated an operating margin profit margin of 8.4%, up 3.6 percentage points year on year. The increase was encouraging, and because its operating margin rose more than its gross margin, we can infer it was more efficient with expenses such as marketing, R&D, and administrative overhead.
Earnings Per Share
Revenue trends explain a company’s historical growth, but the long-term change in earnings per share (EPS) points to the profitability of that growth – for example, a company could inflate its sales through excessive spending on advertising and promotions.
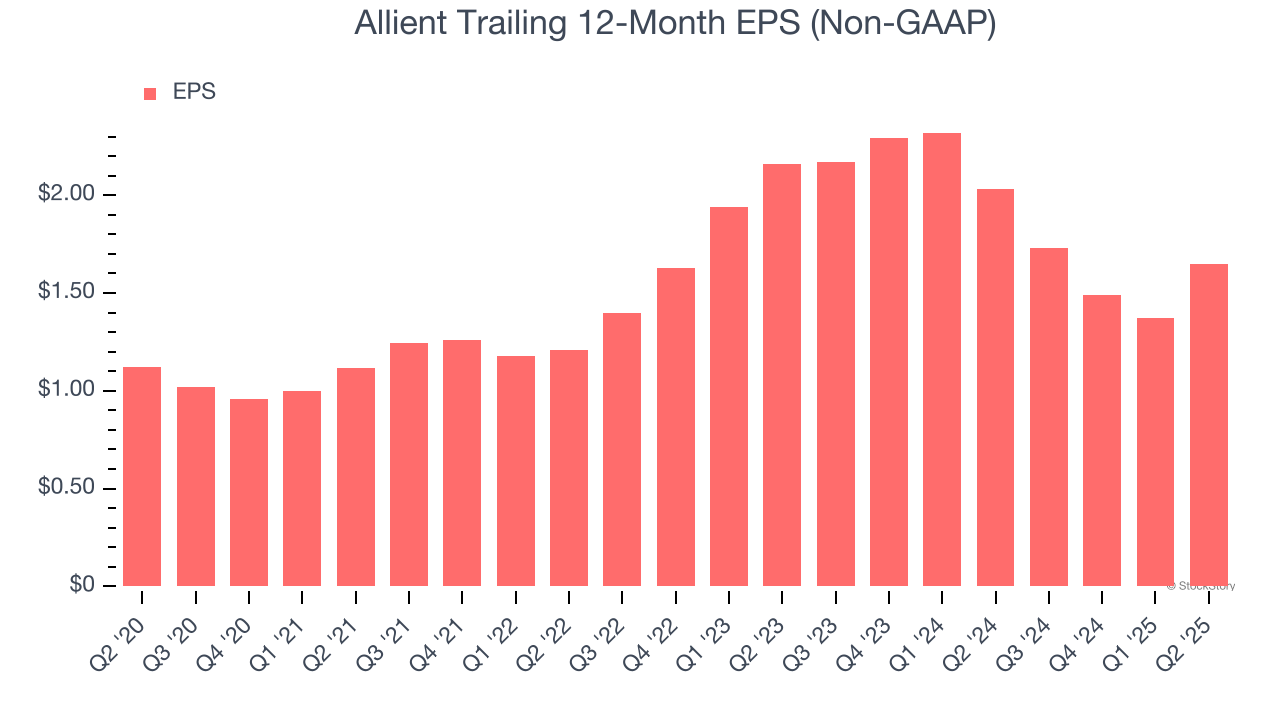
Allient’s decent 8.1% annual EPS growth over the last five years aligns with its revenue performance. This tells us its incremental sales were profitable.
Like with revenue, we analyze EPS over a more recent period because it can provide insight into an emerging theme or development for the business.
Allient’s two-year annual EPS declines of 12.6% were bad and lower than its two-year revenue losses.
Diving into the nuances of Allient’s earnings can give us a better understanding of its performance. A two-year view shows Allient has diluted its shareholders, growing its share count by 3%. This has led to lower per share earnings. Taxes and interest expenses can also affect EPS but don’t tell us as much about a company’s fundamentals. 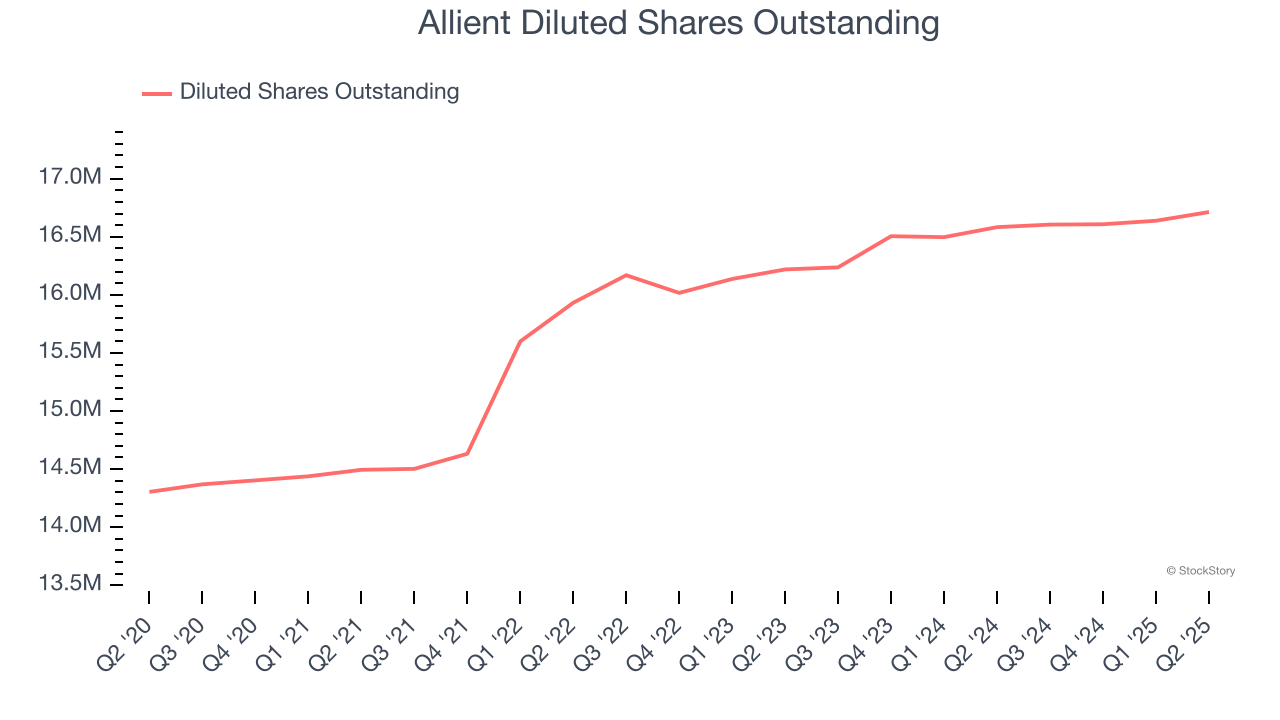
In Q2, Allient reported adjusted EPS at $0.57, up from $0.29 in the same quarter last year. This print easily cleared analysts’ estimates, and shareholders should be content with the results. Over the next 12 months, Wall Street expects Allient’s full-year EPS of $1.65 to grow 25.3%.
Key Takeaways from Allient’s Q2 Results
We were impressed by how significantly Allient blew past analysts’ EBITDA expectations this quarter. We were also excited its revenue outperformed Wall Street’s estimates by a wide margin. Zooming out, we think this quarter featured some important positives. The stock traded up 18.9% to $47.80 immediately after reporting.
Allient had an encouraging quarter, but one earnings result doesn’t necessarily make the stock a buy. Let’s see if this is a good investment. When making that decision, it’s important to consider its valuation, business qualities, as well as what has happened in the latest quarter. We cover that in our actionable full research report which you can read here, it’s free.
More News
View More


Recent Quotes
View More
Quotes delayed at least 20 minutes.
By accessing this page, you agree to the Privacy Policy and Terms Of Service.