GoodRx (NASDAQ:GDRX) Reports Sales Below Analyst Estimates In Q2 Earnings, Stock Drops
Healthcare tech company GoodRx (NASDAQ: GDRX) missed Wall Street’s revenue expectations in Q2 CY2025 as sales only rose 1.2% year on year to $203.1 million. Its non-GAAP profit of $0.09 per share was in line with analysts’ consensus estimates.
Is now the time to buy GoodRx? Find out by accessing our full research report, it’s free.
GoodRx (GDRX) Q2 CY2025 Highlights:
- Revenue: $203.1 million vs analyst estimates of $205.7 million (1.2% year-on-year growth, 1.3% miss)
- Adjusted EPS: $0.09 vs analyst estimates of $0.10 (in line)
- Adjusted EBITDA: $69.4 million vs analyst estimates of $70.62 million (34.2% margin, 1.7% miss)
- EBITDA guidance for the full year is $270 million at the midpoint, below analyst estimates of $279.7 million
- Operating Margin: 13.2%, up from 9.9% in the same quarter last year
- Free Cash Flow Margin: 4.7%, similar to the same quarter last year
- Customers: 5.7 million, down from 6.4 million in the previous quarter
- Market Capitalization: $1.67 billion
Company Overview
Started in 2011 to tackle the problem of high prescription drug costs in America, GoodRx (NASDAQ: GDRX) operates a digital platform that helps consumers find lower prices on prescription medications through price comparison tools and discount codes.
Revenue Growth
A company’s long-term sales performance can indicate its overall quality. Any business can put up a good quarter or two, but the best consistently grow over the long haul. Over the last five years, GoodRx grew its sales at a decent 11.1% compounded annual growth rate. Its growth was slightly above the average healthcare company and shows its offerings resonate with customers.
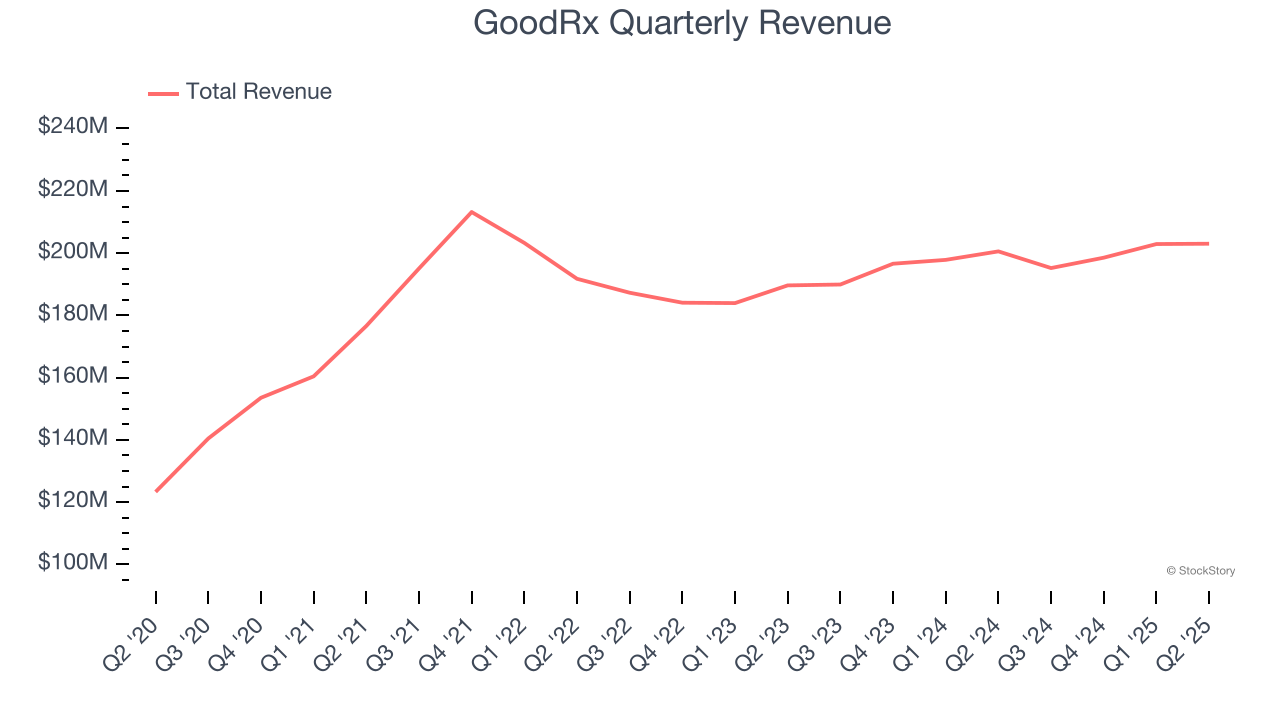
Long-term growth is the most important, but within healthcare, a half-decade historical view may miss new innovations or demand cycles. GoodRx’s recent performance shows its demand has slowed as its annualized revenue growth of 3.6% over the last two years was below its five-year trend. 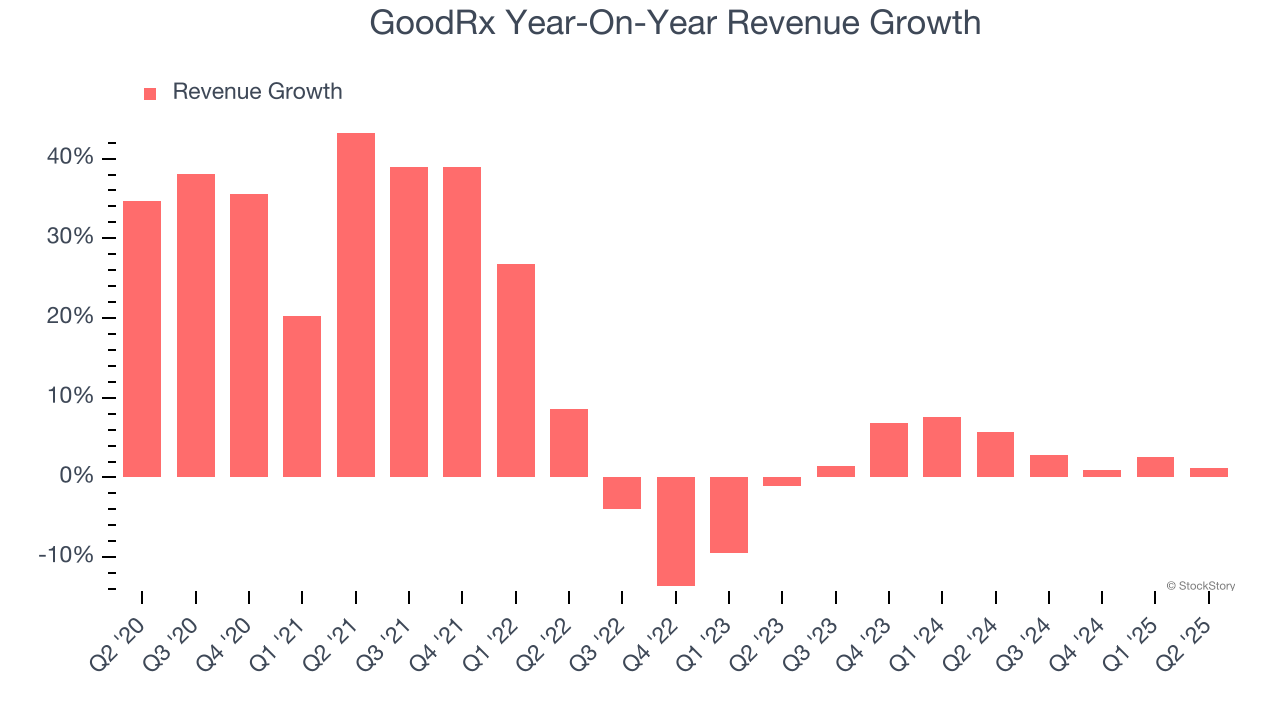
We can better understand the company’s revenue dynamics by analyzing its number of customers, which reached 5.7 million in the latest quarter. Over the last two years, GoodRx’s customer base averaged 2.9% year-on-year growth. Because this number is in line with its revenue growth, we can see the average customer spent roughly the same amount each year on the company’s products and services. 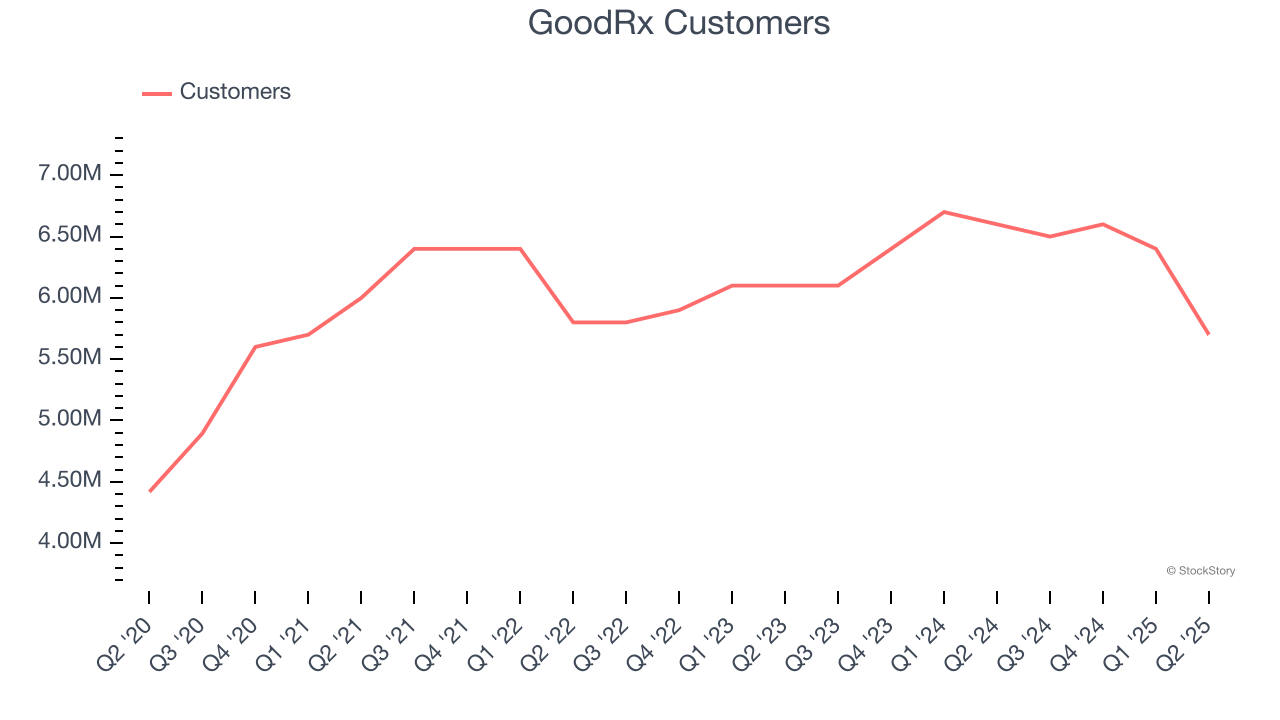
This quarter, GoodRx’s revenue grew by 1.2% year on year to $203.1 million, falling short of Wall Street’s estimates.
Looking ahead, sell-side analysts expect revenue to grow 4.8% over the next 12 months, similar to its two-year rate. While this projection suggests its newer products and services will spur better top-line performance, it is still below average for the sector.
Today’s young investors won’t have read the timeless lessons in Gorilla Game: Picking Winners In High Technology because it was written more than 20 years ago when Microsoft and Apple were first establishing their supremacy. But if we apply the same principles, then enterprise software stocks leveraging their own generative AI capabilities may well be the Gorillas of the future. So, in that spirit, we are excited to present our Special Free Report on a profitable, fast-growing enterprise software stock that is already riding the automation wave and looking to catch the generative AI next.
Adjusted Operating Margin
GoodRx has been an efficient company over the last five years. It was one of the more profitable businesses in the healthcare sector, boasting an average adjusted operating margin of 25.9%.
Analyzing the trend in its profitability, GoodRx’s adjusted operating margin decreased by 5.8 percentage points over the last five years, but it rose by 2.7 percentage points on a two-year basis. Still, shareholders will want to see GoodRx become more profitable in the future.
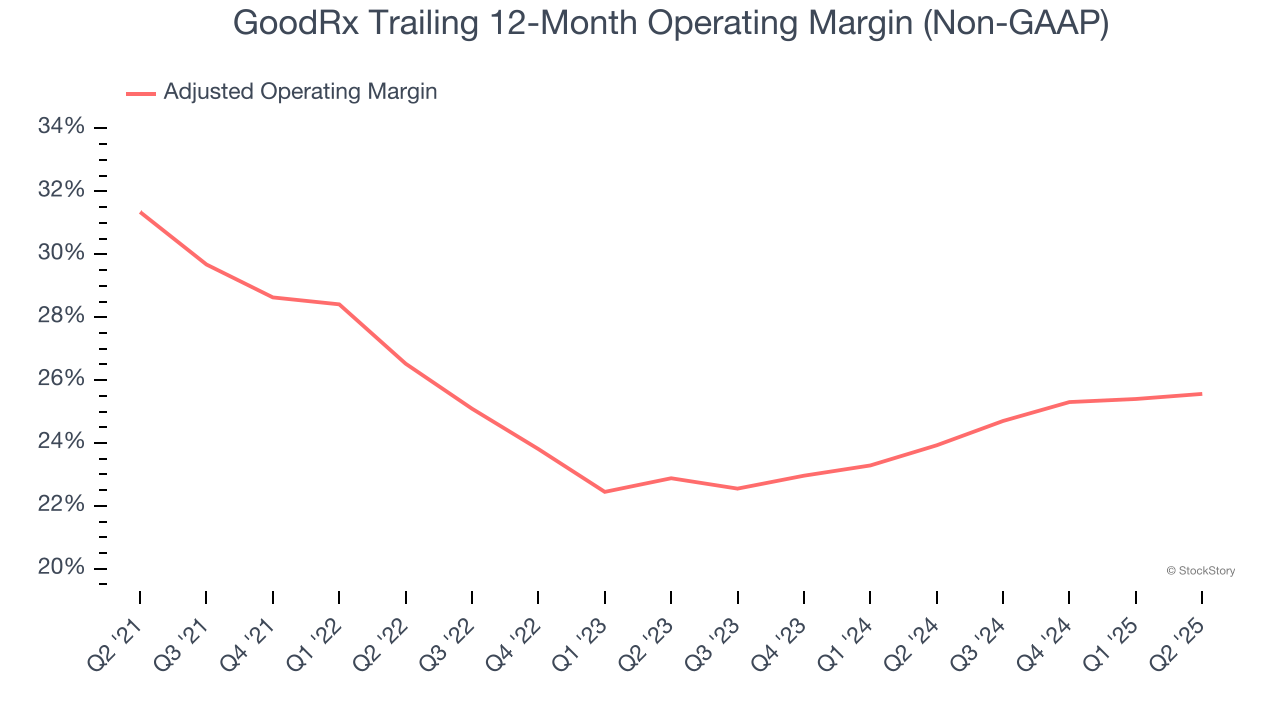
In Q2, GoodRx generated an adjusted operating margin profit margin of 25.8%, in line with the same quarter last year. This indicates the company’s overall cost structure has been relatively stable.
Earnings Per Share
We track the long-term change in earnings per share (EPS) for the same reason as long-term revenue growth. Compared to revenue, however, EPS highlights whether a company’s growth is profitable.
GoodRx’s EPS grew at an unimpressive 3.1% compounded annual growth rate over the last five years, lower than its 11.1% annualized revenue growth. This tells us the company became less profitable on a per-share basis as it expanded.
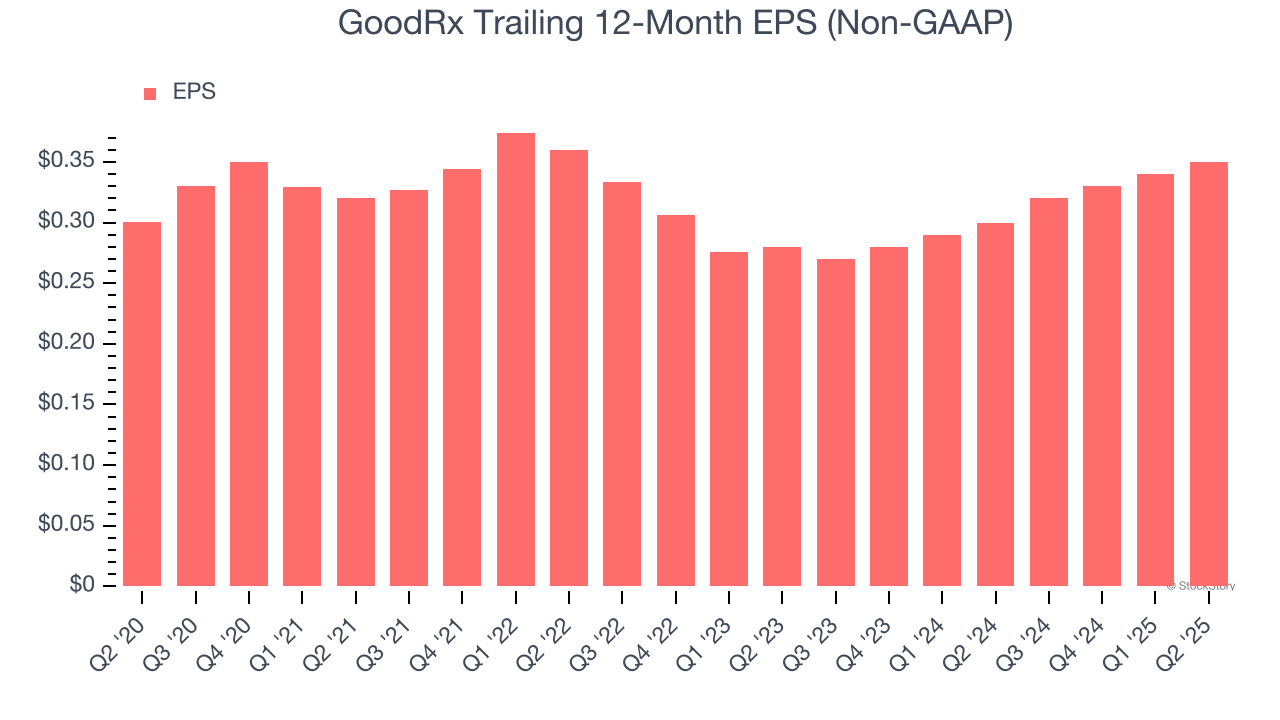
Diving into the nuances of GoodRx’s earnings can give us a better understanding of its performance. As we mentioned earlier, GoodRx’s adjusted operating margin was flat this quarter but declined by 5.8 percentage points over the last five years. This was the most relevant factor (aside from the revenue impact) behind its lower earnings; interest expenses and taxes can also affect EPS but don’t tell us as much about a company’s fundamentals.
In Q2, GoodRx reported adjusted EPS at $0.09, up from $0.08 in the same quarter last year. Despite growing year on year, this print missed analysts’ estimates. Over the next 12 months, Wall Street expects GoodRx to perform poorly. Analysts forecast its full-year EPS of $0.35 will hit $0.42.
Key Takeaways from GoodRx’s Q2 Results
We struggled to find many positives in these results. Its EPS missed and its customer base fell short of Wall Street’s estimates. Overall, this quarter could have been better. The stock traded down 5.2% to $4.12 immediately following the results.
GoodRx’s latest earnings report disappointed. One quarter doesn’t define a company’s quality, so let’s explore whether the stock is a buy at the current price. The latest quarter does matter, but not nearly as much as longer-term fundamentals and valuation, when deciding if the stock is a buy. We cover that in our actionable full research report which you can read here, it’s free.
More News
View More


Recent Quotes
View More
Quotes delayed at least 20 minutes.
By accessing this page, you agree to the Privacy Policy and Terms Of Service.