Papa John's (NASDAQ:PZZA) Exceeds Q2 Expectations, Stock Soars

Fast-food pizza chain Papa John’s (NASDAQ: PZZA) reported Q2 CY2025 results exceeding the market’s revenue expectations, with sales up 4.2% year on year to $529.2 million. Its non-GAAP profit of $0.41 per share was 20.6% above analysts’ consensus estimates.
Is now the time to buy Papa John's? Find out by accessing our full research report, it’s free.
Papa John's (PZZA) Q2 CY2025 Highlights:
- Revenue: $529.2 million vs analyst estimates of $515.4 million (4.2% year-on-year growth, 2.7% beat)
- Adjusted EPS: $0.41 vs analyst estimates of $0.34 (20.6% beat)
- Adjusted EBITDA: $48.82 million vs analyst estimates of $46.82 million (9.2% margin, 4.3% beat)
- EBITDA guidance for the full year is $210 million at the midpoint, above analyst estimates of $204.3 million
- Operating Margin: 4.6%, in line with the same quarter last year
- Free Cash Flow Margin: 3.3%, similar to the same quarter last year
- Locations: 5,989 at quarter end, up from 5,883 in the same quarter last year
- Same-Store Sales rose 1.6% year on year (-2.7% in the same quarter last year)
- Market Capitalization: $1.33 billion
Company Overview
Founded by the eclectic John “Papa John” Schnatter, Papa John’s (NASDAQ: PZZA) is a globally recognized pizza delivery and carryout chain known for “better ingredients” and “better pizza”.
Revenue Growth
A company’s long-term sales performance is one signal of its overall quality. Any business can experience short-term success, but top-performing ones enjoy sustained growth for years.
With $2.09 billion in revenue over the past 12 months, Papa John's is a mid-sized restaurant chain, which sometimes brings disadvantages compared to larger competitors benefiting from better brand awareness and economies of scale.
As you can see below, Papa John’s sales grew at a sluggish 5% compounded annual growth rate over the last six years (we compare to 2019 to normalize for COVID-19 impacts).
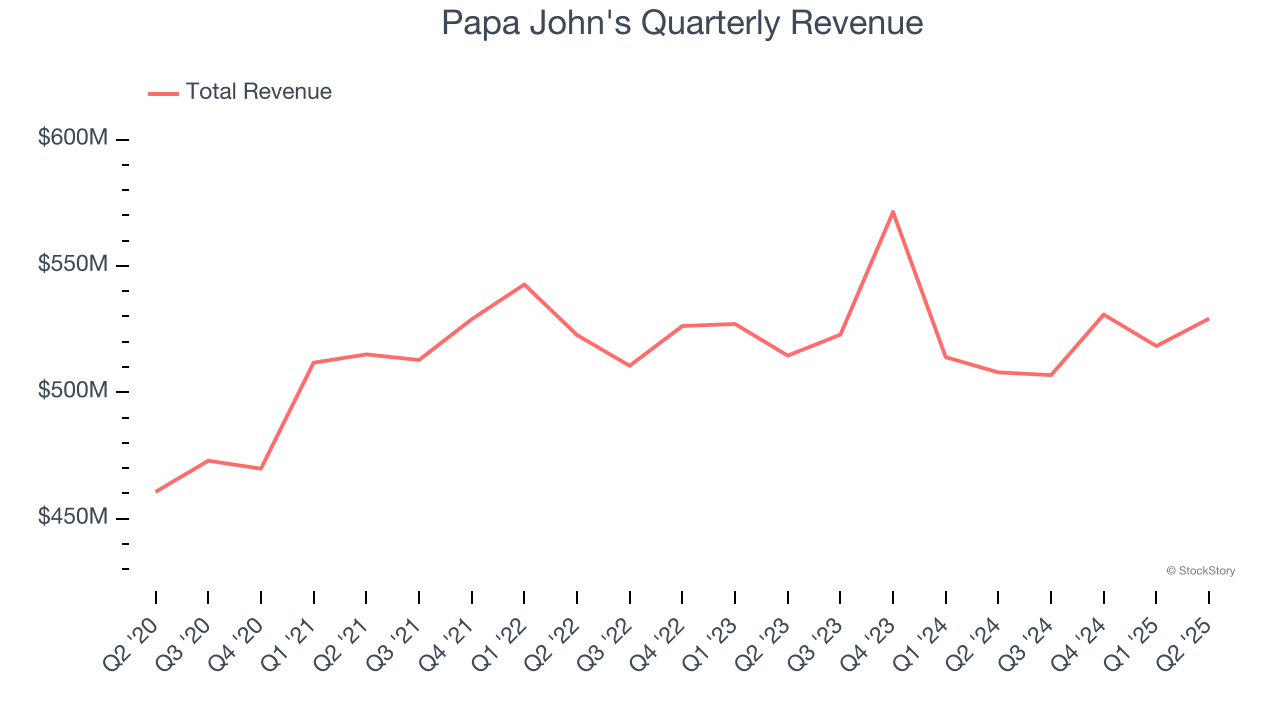
This quarter, Papa John's reported modest year-on-year revenue growth of 4.2% but beat Wall Street’s estimates by 2.7%.
Looking ahead, sell-side analysts expect revenue to grow 2.7% over the next 12 months, a slight deceleration versus the last six years. This projection is underwhelming and indicates its menu offerings will see some demand headwinds.
Software is eating the world and there is virtually no industry left that has been untouched by it. That drives increasing demand for tools helping software developers do their jobs, whether it be monitoring critical cloud infrastructure, integrating audio and video functionality, or ensuring smooth content streaming. Click here to access a free report on our 3 favorite stocks to play this generational megatrend.
Restaurant Performance
Number of Restaurants
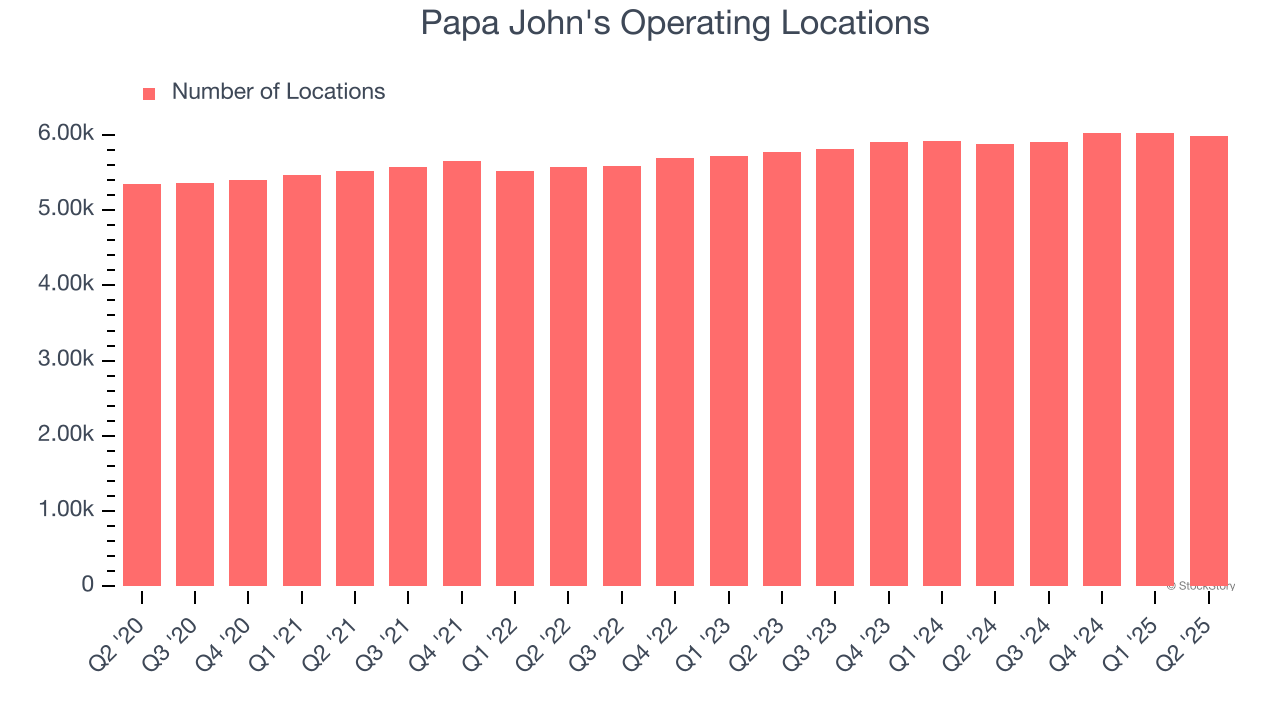
A restaurant chain’s total number of dining locations often determines how much revenue it can generate.
Papa John's operated 5,989 locations in the latest quarter. It has opened new restaurants quickly over the last two years, averaging 2.5% annual growth, faster than the broader restaurant sector. Furthermore, one dynamic making expansion more seamless is the company’s franchise model, where franchisees are primarily responsible for opening new restaurants while Papa John's provides support.
When a chain opens new restaurants, it usually means it’s investing for growth because there’s healthy demand for its meals and there are markets where its concepts have few or no locations.
Same-Store Sales
The change in a company's restaurant base only tells one side of the story. The other is the performance of its existing locations, which informs management teams whether they should expand or downsize their physical footprints. Same-store sales is an industry measure of whether revenue is growing at those existing restaurants and is driven by customer visits (often called traffic) and the average spending per customer (ticket).
Papa John’s demand has been shrinking over the last two years as its same-store sales have averaged 1.2% annual declines. This performance is concerning - it shows Papa John's artificially boosts its revenue by building new restaurants. We’d like to see a company’s same-store sales rise before it takes on the costly, capital-intensive endeavor of expanding its restaurant base.
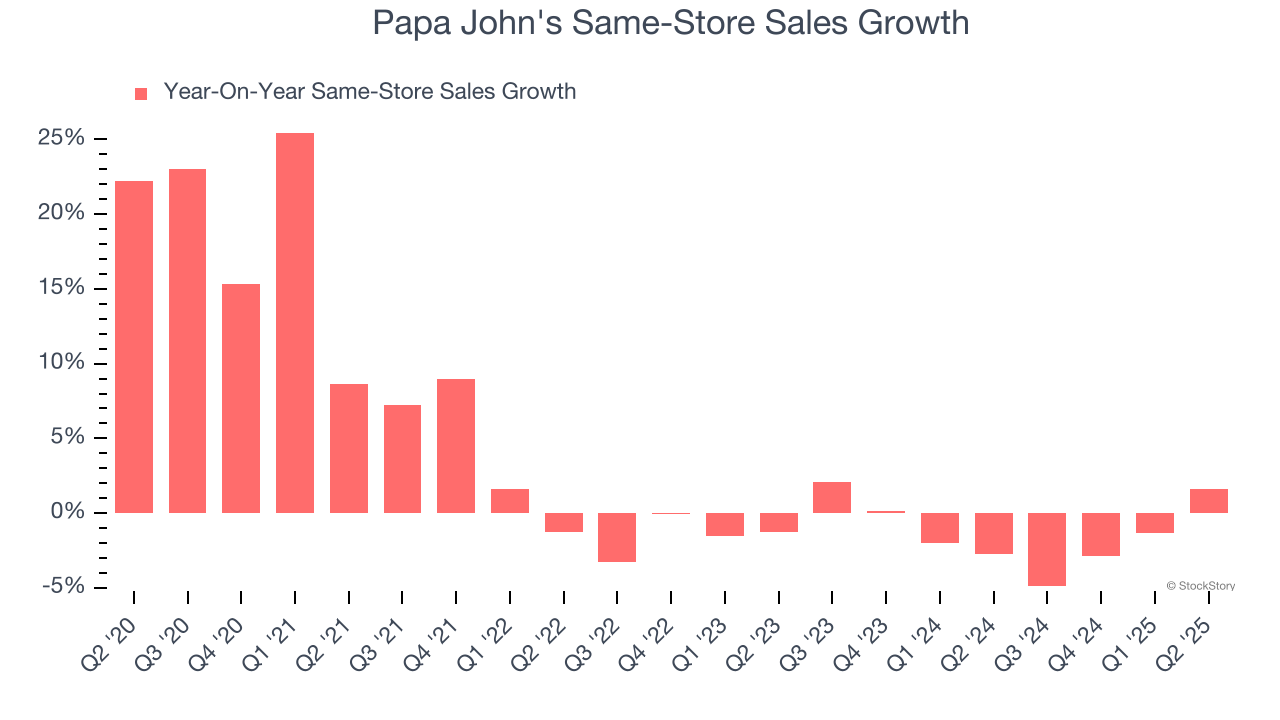
In the latest quarter, Papa John’s same-store sales rose 1.6% year on year. This growth was a well-appreciated turnaround from its historical levels, showing the business is regaining momentum.
Key Takeaways from Papa John’s Q2 Results
We enjoyed seeing Papa John's beat analysts’ same-store sales expectations this quarter. We were also glad its revenue outperformed Wall Street’s estimates. Zooming out, we think this was a solid print. The stock traded up 9.7% to $44.47 immediately following the results.
Papa John's may have had a good quarter, but does that mean you should invest right now? When making that decision, it’s important to consider its valuation, business qualities, as well as what has happened in the latest quarter. We cover that in our actionable full research report which you can read here, it’s free.
More News
View More


Recent Quotes
View More
Quotes delayed at least 20 minutes.
By accessing this page, you agree to the Privacy Policy and Terms Of Service.