Dave & Buster's (NASDAQ:PLAY) Reports Sales Below Analyst Estimates In Q2 Earnings, Stock Drops

Arcade company Dave & Buster’s (NASDAQ: PLAY) fell short of the market’s revenue expectations in Q2 CY2025, with sales flat year on year at $557.4 million. Its non-GAAP profit of $0.40 per share was 56.6% below analysts’ consensus estimates.
Is now the time to buy Dave & Buster's? Find out by accessing our full research report, it’s free.
Dave & Buster's (PLAY) Q2 CY2025 Highlights:
- Revenue: $557.4 million vs analyst estimates of $562.7 million (flat year on year, 0.9% miss)
- Adjusted EPS: $0.40 vs analyst expectations of $0.92 (56.6% miss)
- Adjusted EBITDA: $129.8 million vs analyst estimates of $137.9 million (23.3% margin, 5.9% miss)
- Operating Margin: 9.5%, down from 15.2% in the same quarter last year
- Same-Store Sales fell 3% year on year (-6.3% in the same quarter last year)
- Market Capitalization: $817.4 million
“I am deeply honored to take the helm and collaborate with this talented team to drive innovation, growth, and the company’s next chapter,” said Tarun Lal, Chief Executive Officer.
Company Overview
Founded by a former game parlor and bar operator, Dave & Buster’s (NASDAQ: PLAY) operates a chain of arcades providing immersive entertainment experiences.
Revenue Growth
A company’s long-term sales performance can indicate its overall quality. Any business can experience short-term success, but top-performing ones enjoy sustained growth for years. Over the last five years, Dave & Buster's grew its sales at a solid 19.8% compounded annual growth rate. Its growth beat the average consumer discretionary company and shows its offerings resonate with customers.
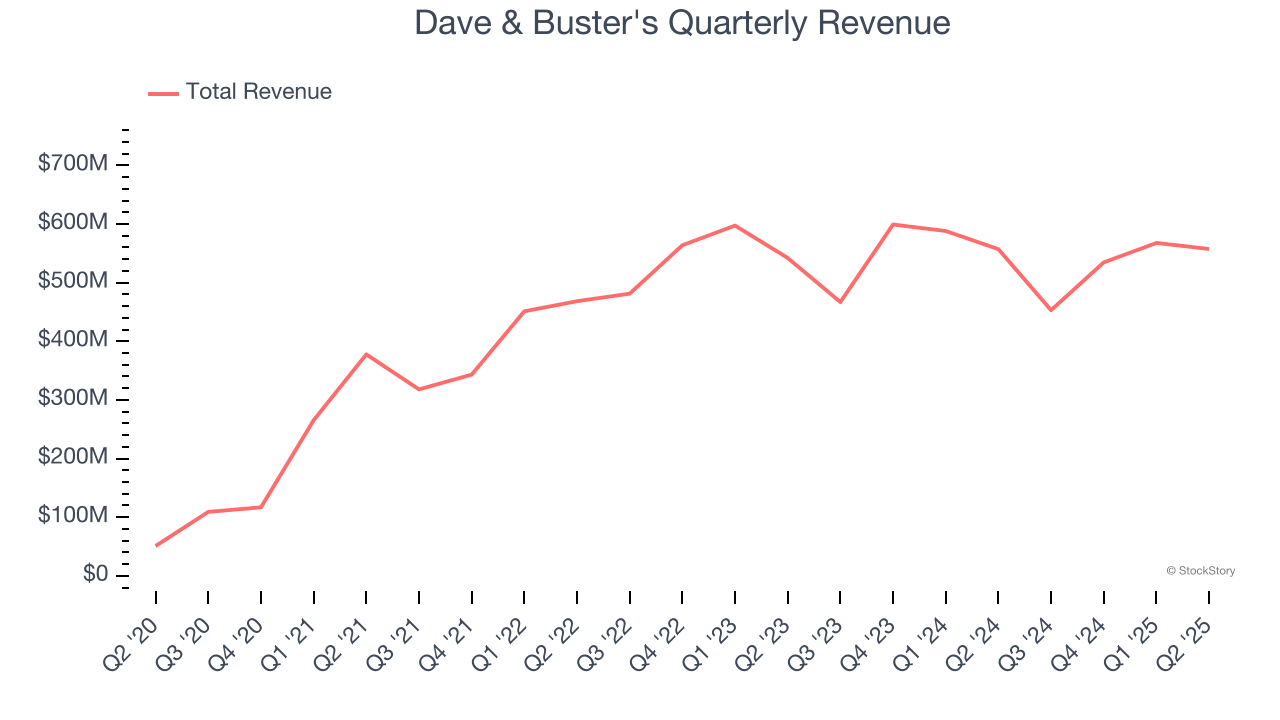
Long-term growth is the most important, but within consumer discretionary, product cycles are short and revenue can be hit-driven due to rapidly changing trends and consumer preferences. Dave & Buster’s recent performance marks a sharp pivot from its five-year trend as its revenue has shown annualized declines of 1.7% over the last two years. Note that COVID hurt Dave & Buster’s business in 2020 and part of 2021, and it bounced back in a big way thereafter. 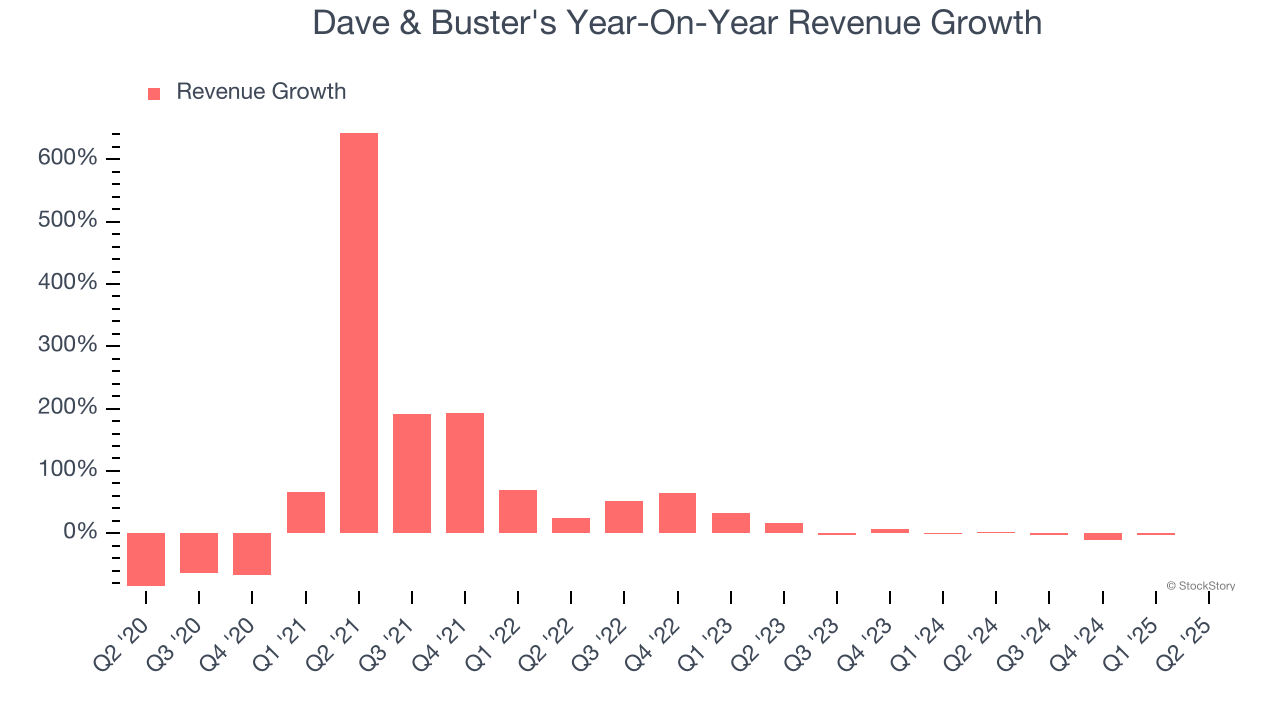
We can better understand the company’s revenue dynamics by analyzing its same-store sales, which show how much revenue its established locations generate. Over the last two years, Dave & Buster’s same-store sales averaged 6.9% year-on-year declines. Because this number is lower than its revenue growth, we can see the opening of new locations is boosting the company’s top-line performance. 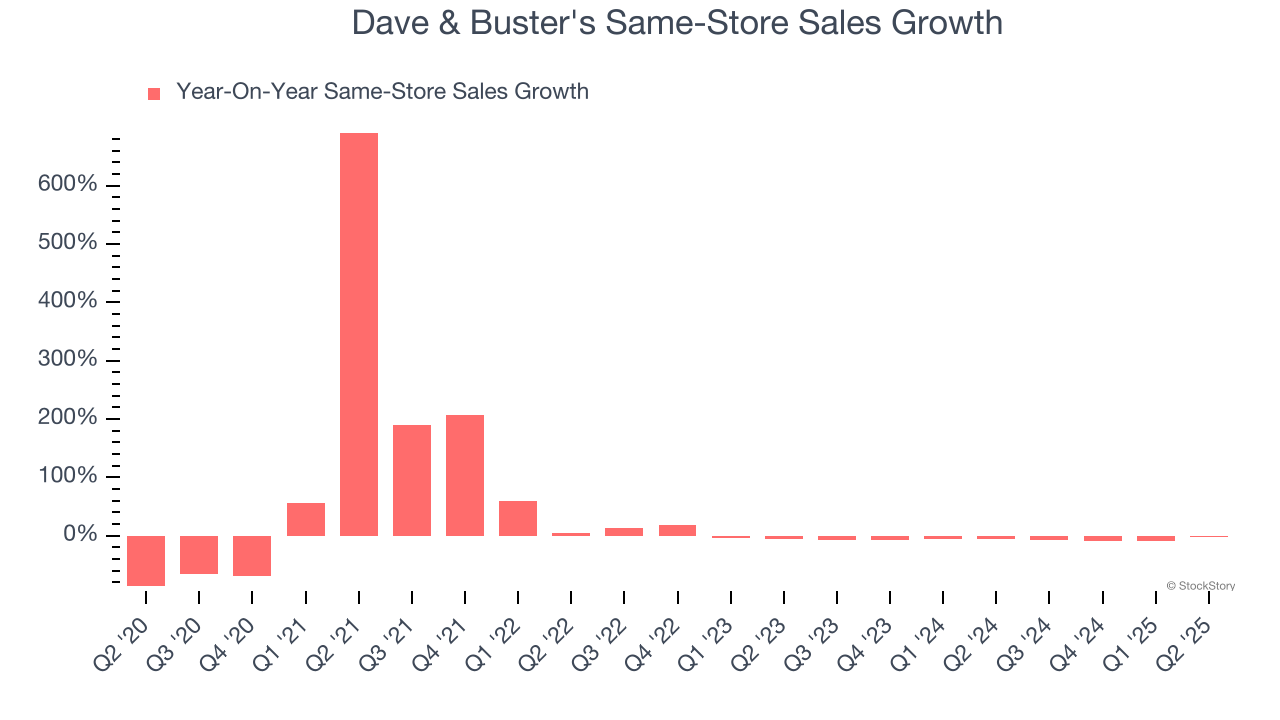
This quarter, Dave & Buster’s $557.4 million of revenue was flat year on year, falling short of Wall Street’s estimates.
Looking ahead, sell-side analysts expect revenue to grow 5.8% over the next 12 months. While this projection indicates its newer products and services will spur better top-line performance, it is still below average for the sector.
Software is eating the world and there is virtually no industry left that has been untouched by it. That drives increasing demand for tools helping software developers do their jobs, whether it be monitoring critical cloud infrastructure, integrating audio and video functionality, or ensuring smooth content streaming. Click here to access a free report on our 3 favorite stocks to play this generational megatrend.
Operating Margin
Operating margin is a key measure of profitability. Think of it as net income - the bottom line - excluding the impact of taxes and interest on debt, which are less connected to business fundamentals.
Dave & Buster’s operating margin has been trending down over the last 12 months, but it still averaged 10.3% over the last two years, decent for a consumer discretionary business. This shows it generally does a decent job managing its expenses, and its solid historical revenue growth also suggests its margin dropped because it ramped up investments to capture market share. We’ll keep a close eye to see if this strategy pays off.
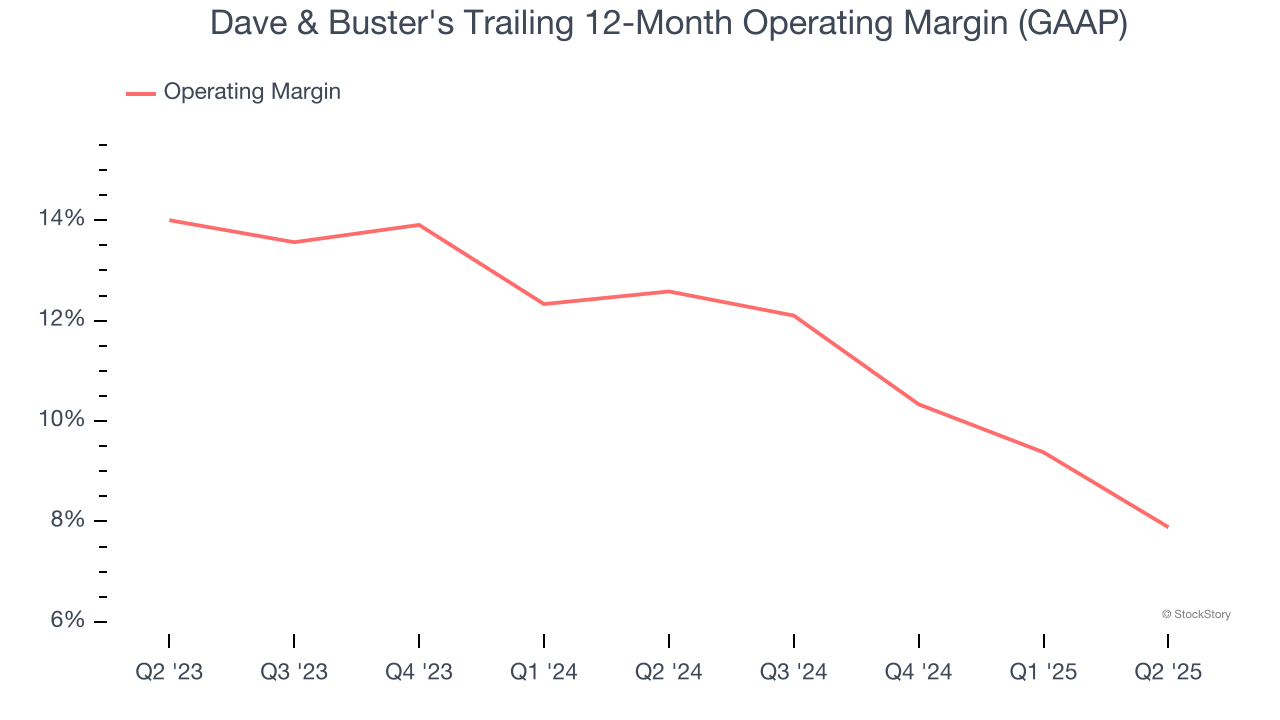
In Q2, Dave & Buster's generated an operating margin profit margin of 9.5%, down 5.7 percentage points year on year. This contraction shows it was less efficient because its expenses increased relative to its revenue.
Earnings Per Share
Revenue trends explain a company’s historical growth, but the long-term change in earnings per share (EPS) points to the profitability of that growth – for example, a company could inflate its sales through excessive spending on advertising and promotions.
Dave & Buster’s full-year EPS flipped from negative to positive over the last five years. This is encouraging and shows it’s at a critical moment in its life.
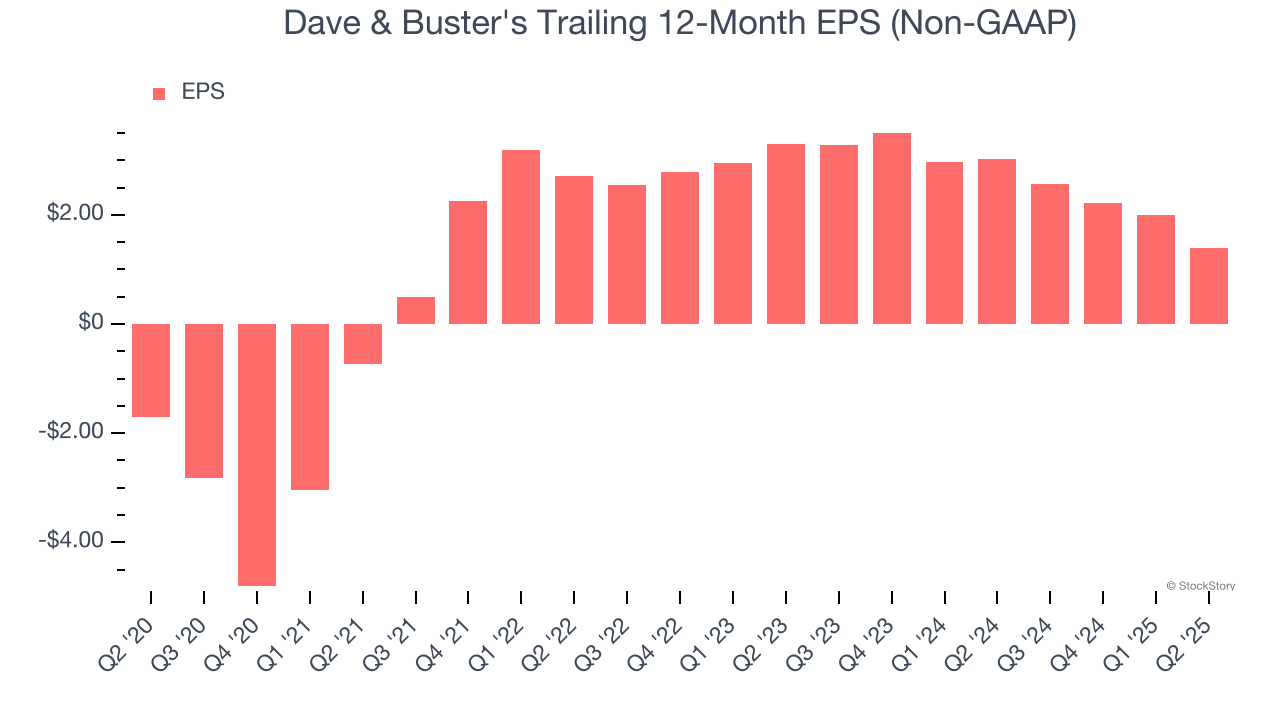
In Q2, Dave & Buster's reported adjusted EPS of $0.40, down from $0.99 in the same quarter last year. This print missed analysts’ estimates, but we care more about long-term adjusted EPS growth than short-term movements. Over the next 12 months, Wall Street expects Dave & Buster’s full-year EPS of $1.40 to grow 42.5%.
Key Takeaways from Dave & Buster’s Q2 Results
We struggled to find many positives in these results. Its EPS missed and its same-store sales fell slightly short of Wall Street’s estimates. Overall, this was a softer quarter. The stock traded down 9.8% to $21.85 immediately following the results.
Dave & Buster’s latest earnings report disappointed. One quarter doesn’t define a company’s quality, so let’s explore whether the stock is a buy at the current price. When making that decision, it’s important to consider its valuation, business qualities, as well as what has happened in the latest quarter. We cover that in our actionable full research report which you can read here, it’s free.
More News
View More


Recent Quotes
View More
Quotes delayed at least 20 minutes.
By accessing this page, you agree to the Privacy Policy and Terms Of Service.