GUANGZHOU, China, May 29, 2024 (GLOBE NEWSWIRE) -- Burning Rock Biotech Limited (NASDAQ: BNR and LSE: BNR, the “Company” or “Burning Rock”), a company focused on the application of next generation sequencing (NGS) technology in the field of precision oncology, today reported financial results for the three months ended March 31, 2024.
Recent Business Updates
- Early Detection
- THUNDER study for 6-cancer test was included in the Diagnosis and Treatment Guidelines for Primary Liver Cancer (2024 Edition) and the Expert Consensus on Detection and Clinical Application of Tumor DNA Methylation Markers (2024 Edition), showing an impressive performance of ELSA-seq using cfDNA in cancer detection and origin prediction.
- Pharma Services
- Total value of new contracts during the first quarter of 2024 amounted to RMB218 million, representing a growth over 100% from the same period in 2023.
First Quarter 2024 Financial Results
Total Revenues were RMB125.6 million (US$17.4 million) for the three months ended March 31, 2024, representing a 11.9% decrease from RMB142.5 million for the same period in 2023, as we transition from central-lab to more in-hospital based testing. Importantly, in-hospital segment continued its double-digit growth.
- Revenue generated from in-hospital business was RMB57.4 million (US$7.9 million) for the three months ended March 31, 2024, representing a 11.3% increase from RMB51.6 million for the same period in 2023, driven by an increase in sales volume.
- Revenue generated from central laboratory business was RMB47.6 million (US$6.6 million) for the three months ended March 31, 2024, representing a 23.0% decrease from RMB61.8 million for the same period in 2023, primarily attributable to a decrease in the number of tests, as we continued our transition towards in-hospital testing.
- Revenue generated from pharma research and development services was RMB20.6 million (US$2.9 million) for the three months ended March 31, 2024, representing a 29.3% decrease from RMB29.2 million for the same period in 2023, primarily attributable to decreased testing services performed for our pharma customers due to timing of lumpy projects.
Cost of revenues was RMB39.9 million (US$5.5 million) for the three months ended March 31, 2024, representing an 8.7% decrease from RMB43.7 million for the same period in 2023, primarily due to a decrease in cost of central laboratory business, which was in line with the decrease in revenue generated from this business and partially offset by an increase in sales volume of in-hospital business and a decrease in depreciation expense for all kinds of business.
Gross profit was RMB85.7 million (US$11.9 million) for the three months ended March 31, 2024, representing a 13.2% decrease from RMB98.8 million for the same period in 2023. Gross margin was 68.2% for the three months ended March 31, 2024, compared to 69.3% for the same period in 2023. By channel, gross margin of central laboratory business was 77.7% for the three months ended March 31, 2024, compared to 77.8% during the same period in 2023; gross margin of in-hospital business was 68.3% for the three months ended March 31, 2024, compared to 66.7% during the same period in 2023, primarily due to a decrease in amortization; gross margin of pharma research and development services was 46.1% for the three months ended March 31, 2024, compared to 55.8% during the same period of 2023.
Non-GAAP gross profit, which excludes depreciation and amortization expenses, was RMB93.0 million (US$12.9 million) for the three months ended March 31, 2024, representing a 13.8% decrease from RMB107.9 million for the same period in 2023. Non-GAAP gross margin was 74.0% for the three months ended March 31, 2024, compared to 75.7% for the same period in 2023.
Operating expenses were RMB211.5 million (US$29.3 million) for the three months ended March 31, 2024, representing a 26.4% decrease from RMB287.2 million for the same period in 2023. The decrease was primarily driven by improved operating efficiency.
- Research and development expenses were RMB66.0 million (US$9.1 million) for the three months ended March 31, 2024, representing a 30.1% decrease from RMB94.4 million for the same period in 2023, primarily due to (i) a decrease in staff cost resulted from the reorganization of our research and development department to improve operating efficiency, and (ii) a decrease in the expenditure for research projects.
- Selling and marketing expenses were RMB46.9 million (US$6.5 million) for the three months ended March 31, 2024, representing a 27.7% decrease from RMB64.8 million for the same period in 2023, primarily due to (i) a decrease in staff cost resulted from the reorganization of the sales department and improvement in operating efficiency; (ii) a decrease in conference fee; and (iii) a decrease in travel expense.
- General and administrative expenses were RMB98.7 million (US$13.7 million) for the three months ended March 31, 2024, representing a 22.9% decrease from RMB128.0 million for the same period in 2023, primarily due to (i) a decrease in general and administrative personnel’s staff cost, and (ii) a decrease in amortized expenses for office building; (iii) a decrease in the provision for allowance for doubtful accounts.
Net loss was RMB121.5 million (US$16.8 million) for the three months ended March 31, 2024, compared to RMB185.3 million for the same period in 2023.
Cash, cash equivalents, restricted cash and short-term investments were RMB572.7 million (US$79.3 million) as of March 31, 2024.
2024 Financial Guidance
We currently expect to achieve breakeven (measured by non-GAAP gross profit minus non-GAAP SG&A) for the full year 2024.
Non-GAAP gross profit refers to gross profit excluding depreciation and amortization. Non-GAAP SG&A refers to selling and marketing expenses and general and administrative expenses, both excluding their respective share-based compensation and depreciation and amortization.
Corporate structure reorganization
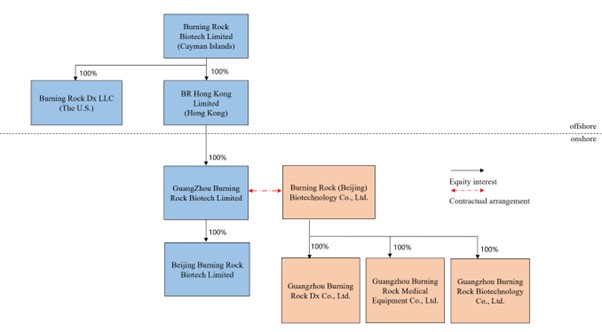
The Company moved its PRC onshore headquarter from Beijing to Guangzhou in May 2024. Burning Rock Biotech Limited, our ultimate Cayman Islands holding company, does not have any substantive operations other than directly controlling Guangzhou Burning Rock Biotech Limited, our new wholly foreign owned entity, or WFOE, and indirectly controlling Burning Rock (Beijing) Biotechnology Co., Ltd., the variable interest entity, or VIE, through certain contractual arrangements. The equity change of Beijing Burning Rock Biotech Limited had been completed, and certain contractual agreements had been amended. The chart below sets forth our corporate structure and identifies our principal subsidiaries as of the date of this release:
Conference Call Information
Burning Rock will host a conference call to discuss the first quarter 2024 financial results at 8:00 a.m. U.S. Eastern Time (8:00 p.m. Hong Kong time) on May 29, 2024.
Please register in advance of the conference using the link provided below and dial in 15 minutes prior to the call, using participant dial-in numbers and unique registrant ID which would be provided upon registering.
PRE-REGISTER LINK: https://register.vevent.com/register/BIbdb6210ab73d4bb7b25e3ffbdc206d07.
Additionally, a live and archived webcast of the conference call will also be available on the company’s investor relations website at http://ir.brbiotech.com or through link https://edge.media-server.com/mmc/p/ovj2q2n6.
A replay of the webcast will be available for 12 months via the same link above.
About Burning Rock
Burning Rock Biotech Limited (NASDAQ: BNR and LSE: BNR), whose mission is to guard life via science, focuses on the application of next generation sequencing (NGS) technology in the field of precision oncology. Its business consists of i) NGS-based therapy selection testing for late-stage cancer patients, and ii) cancer early detection, which has moved beyond proof-of-concept R&D into the clinical validation stage.
For more information about Burning Rock, please visit: ir.brbiotech.com.
Safe Harbor Statement
This press release contains forward-looking statements. These statements constitute “forward-looking” statements within the meaning of Section 21E of the Securities Exchange Act of 1934, as amended, and as defined in the U.S. Private Securities Litigation Reform Act of 1995. These forward-looking statements can be identified by terminology such as “will,” “expects,” “anticipates,” “future,” “intends,” “plans,” “believes,” “estimates,” “target,” “confident” and similar statements. Burning Rock may also make written or oral forward-looking statements in its periodic reports to the SEC, in its annual report to shareholders, in press releases and other written materials and in oral statements made by its officers, directors or employees to third parties. Statements that are not historical facts, including statements about Burning Rock’s beliefs and expectations, are forward-looking statements. Such statements are based upon management’s current expectations and current market and operating conditions, and relate to events that involve known or unknown risks, uncertainties and other factors, all of which are difficult to predict and many of which are beyond Burning Rock’s control. Forward-looking statements involve risks, uncertainties and other factors that could cause actual results to differ materially from those contained in any such statements. All information provided in this press release is as of the date of this press release, and Burning Rock does not undertake any obligation to update any forward-looking statement as a result of new information, future events or otherwise, except as required under applicable law.
Non-GAAP Measures
In evaluating the business, the Company considers and uses non-GAAP measures, such as non-GAAP gross profit and non-GAAP gross margin, as supplemental measures to review and assess operating performance. The presentation of these non-GAAP financial measures is not intended to be considered in isolation or as a substitute for the financial information prepared and presented in accordance with accounting principles generally accepted in the United States of America (“U.S. GAAP”). The company defines non-GAAP gross profit as gross profit excluding depreciation and amortization. The company defines non-GAAP gross margin as gross margin excluding depreciation and amortization.
The company presents these non-GAAP financial measures because they are used by management to evaluate operating performance and formulate business plans. The company believe non-GAAP gross profit and non-GAAP gross margin excluding non-cash impact of depreciation and amortization reflect the company’s ongoing business operations in a manner that allows more meaningful period-to-period comparisons.
Contact: IR@brbiotech.com
| Selected Operating Data | |||||||||
| As of | |||||||||
| March 31, 2023 | June 30, 2023 | September 30, 2023 | December 31, 2023 | March 31, 2024 | |||||
| In-hospital Channel: | |||||||||
| Pipeline partner hospitals(1) | 29 | 30 | 29 | 28 | 28 | ||||
| Contracted partner hospitals(2) | 49 | 50 | 55 | 59 | 59 | ||||
| Total number of partner hospitals | 78 | 80 | 84 | 87 | 87 | ||||
(1) Refers to hospitals that are in the process of establishing in-hospital laboratories, laboratory equipment procurement or installation, staff training or pilot testing using the Company’s products.
(2) Refers to hospitals that have entered into contracts to purchase the Company’s products for use on a recurring basis in their respective in-hospital laboratories the Company helped them establish. Kit revenue is generated from contracted hospitals.
| Selected Financial Data | |||||||||
| For the three months ended | |||||||||
| Revenues | March 31, 2023 | June 30, 2023 | September 30, 2023 | December 31, 2023 | March 31, 2024 | ||||
| (RMB in thousands) | |||||||||
| Central laboratory channel | 61,804 | 66,239 | 53,481 | 51,288 | 47,614 | ||||
| In-hospital channel | 51,561 | 53,835 | 54,496 | 28,809 | 57,387 | ||||
| Pharma research and development channel | 29,151 | 26,194 | 19,589 | 40,988 | 20,622 | ||||
| Total revenues | 142,516 | 146,268 | 127,566 | 121,085 | 125,623 | ||||
| For the three months ended | |||||||||
| Gross profit | March 31, 2023 | June 30, 2023 | September 30, 2023 | December 31, 2023 | March 31, 2024 | ||||
| (RMB in thousands) | |||||||||
| Central laboratory channel | 48,090 | 51,876 | 41,487 | 41,886 | 37,002 | ||||
| In-hospital channel | 34,409 | 33,353 | 35,459 | 12,910 | 39,192 | ||||
| Pharma research and development channel | 16,273 | 15,193 | 8,974 | 23,317 | 9,500 | ||||
| Total gross profit | 98,772 | 100,422 | 85,920 | 78,113 | 85,694 | ||||
| For the three months ended | |||||||||
| Share-based compensation expenses | March 31, 2023 | June 30, 2023 | September 30, 2023 | December 31, 2023 | March 31, 2024 | ||||
| (RMB in thousands) | |||||||||
| Cost of revenues | 353 | 627 | 680 | 654 | 596 | ||||
| Research and development expenses | 13,612 | 15,301 | 12,161 | 12,401 | 12,287 | ||||
| Selling and marketing expenses | 1,606 | 3,389 | 2,848 | 1,816 | 508 | ||||
| General and administrative expenses | 62,595 | 18,502 | 57,704 | 56,472 | 55,990 | ||||
| Total share-based compensation expenses | 78,166 | 37,819 | 73,393 | 71,343 | 69,381 | ||||
| Burning Rock Biotech Limited Unaudited Condensed Statements of Comprehensive Loss (in thousands, except for number of shares and per share data) | |||||||||||||||||
| For the three months ended | |||||||||||||||||
| March 31, 2023 | June 30, 2023 | September 30, 2023 | December 31, 2023 | March 31, 2024 | March 31, 2024 | ||||||||||||
| RMB | RMB | RMB | RMB | RMB | US$ | ||||||||||||
| Revenues | 142,516 | 146,268 | 127,566 | 121,085 | 125,623 | 17,399 | |||||||||||
| Cost of revenues | (43,744 | ) | (45,846 | ) | (41,646 | ) | (42,972 | ) | (39,929 | ) | (5,531 | ) | |||||
| Gross profit | 98,772 | 100,422 | 85,920 | 78,113 | 85,694 | 11,868 | |||||||||||
| Operating expenses: | |||||||||||||||||
| Research and development expenses | (94,417 | ) | (95,779 | ) | (83,701 | ) | (73,119 | ) | (65,985 | ) | (9,139 | ) | |||||
| Selling and marketing expenses | (64,774 | ) | (70,842 | ) | (62,310 | ) | (49,785 | ) | (46,856 | ) | (6,489 | ) | |||||
| General and administrative expenses | (128,039 | ) | (69,525 | ) | (118,724 | ) | (121,533 | ) | (98,681 | ) | (13,667 | ) | |||||
| Total operating expenses | (287,230 | ) | (236,146 | ) | (264,735 | ) | (244,437 | ) | (211,522 | ) | (29,295 | ) | |||||
| Loss from operations | (188,458 | ) | (135,724 | ) | (178,815 | ) | (166,324 | ) | (125,828 | ) | (17,427 | ) | |||||
| Interest income | 3,144 | 5,255 | 4,018 | 5,539 | 4,038 | 559 | |||||||||||
| Other income (expense), net | 599 | (118 | ) | (157 | ) | 160 | 434 | 60 | |||||||||
| Foreign exchange (loss) gain, net | (116 | ) | (210 | ) | 423 | (517 | ) | (13 | ) | (2 | ) | ||||||
| Loss before income tax | (184,831 | ) | (130,797 | ) | (174,531 | ) | (161,142 | ) | (121,369 | ) | (16,810 | ) | |||||
| Income tax expenses | (422 | ) | (445 | ) | (450 | ) | (1,071 | ) | (180 | ) | (25 | ) | |||||
| Net loss | (185,253 | ) | (131,242 | ) | (174,981 | ) | (162,213 | ) | (121,549 | ) | (16,835 | ) | |||||
| Net loss attributable to Burning Rock Biotech Limited’s shareholders | (185,253 | ) | (131,242 | ) | (174,981 | ) | (162,213 | ) | (121,549 | ) | (16,835 | ) | |||||
| Net loss attributable to ordinary shareholders | (185,253 | ) | (131,242 | ) | (174,981 | ) | (162,213 | ) | (121,549 | ) | (16,835 | ) | |||||
| Loss per share for class A and class B ordinary shares: | |||||||||||||||||
| Class A ordinary shares - basic and diluted | (1.81 | ) | (1.28 | ) | (1.71 | ) | (1.58 | ) | (1.19 | ) | (0.16 | ) | |||||
| Class B ordinary shares - basic and diluted | (1.81 | ) | (1.28 | ) | (1.71 | ) | (1.58 | ) | (1.19 | ) | (0.16 | ) | |||||
| Weighted average shares outstanding used in loss per share computation: | |||||||||||||||||
| Class A ordinary shares - basic and diluted | 85,065,585 | 85,151,052 | 85,000,869 | 85,071,360 | 85,219,188 | 85,219,188 | |||||||||||
| Class B ordinary shares - basic and diluted | 17,324,848 | 17,324,848 | 17,324,848 | 17,324,848 | 17,324,848 | 17,324,848 | |||||||||||
| Other comprehensive income (loss), net of tax of nil: | |||||||||||||||||
| Foreign currency translation adjustments | (5,659 | ) | 14,829 | (1,955 | ) | (3,026 | ) | 590 | 82 | ||||||||
| Total comprehensive loss | (190,912 | ) | (116,413 | ) | (176,936 | ) | (165,239 | ) | (120,959 | ) | (16,753 | ) | |||||
| Total comprehensive loss attributable to Burning Rock Biotech Limited’s shareholders | (190,912 | ) | (116,413 | ) | (176,936 | ) | (165,239 | ) | (120,959 | ) | (16,753 | ) | |||||
| Burning Rock Biotech Limited Unaudited Condensed Consolidated Balance Sheets (In thousands) | |||||
| As of | |||||
| December 31, 2023 | March 31, 2024 | March 31, 2024 | |||
| RMB | RMB | US$ | |||
| ASSETS | |||||
| Current assets: | |||||
| Cash and cash equivalents | 615,096 | 572,616 | 79,306 | ||
| Restricted cash | 120 | 58 | 8 | ||
| Accounts receivable, net | 126,858 | 135,360 | 18,747 | ||
| Contract assets, net | 22,748 | 23,063 | 3,194 | ||
| Inventories, net | 69,020 | 63,121 | 8,742 | ||
| Prepayments and other current assets, net | 50,254 | 46,630 | 6,458 | ||
| Total current assets | 884,096 | 840,848 | 116,455 | ||
| Non-current assets: | |||||
| Equity method investment | 337 | 249 | 34 | ||
| Convertible note receivable | 5,320 | 5,320 | 737 | ||
| Property and equipment, net | 131,912 | 114,498 | 15,858 | ||
| Operating right-of-use assets | 12,284 | 19,655 | 2,722 | ||
| Intangible assets, net | 964 | 747 | 103 | ||
| Other non-current assets | 5,088 | 3,609 | 500 | ||
| Total non-current assets | 155,905 | 144,078 | 19,954 | ||
| TOTAL ASSETS | 1,040,001 | 984,926 | 136,409 | ||
| Burning Rock Biotech Limited Unaudited Condensed Consolidated Balance Sheets (Continued) (in thousands) | ||||||||
| As of | ||||||||
| December 31, 2023 | March 31, 2024 | March 31, 2024 | ||||||
| RMB | RMB | US$ | ||||||
| LIABILITIES AND SHAREHOLDERS’ EQUITY | ||||||||
| Current liabilities: | ||||||||
| Accounts payable | 18,061 | 24,630 | 3,411 | |||||
| Deferred revenue | 130,537 | 127,516 | 17,661 | |||||
| Accrued liabilities and other current liabilities | 104,935 | 91,037 | 12,608 | |||||
| Customer deposits | 1,197 | 1,197 | 166 | |||||
| Current portion of operating lease liabilities | 8,634 | 11,026 | 1,527 | |||||
| Total current liabilities | 263,364 | 255,406 | 35,373 | |||||
| Non-current liabilities: | ||||||||
| Non-current portion of operating lease liabilities | 3,690 | 7,971 | 1,104 | |||||
| Other non-current liabilities | 4,537 | 4,717 | 651 | |||||
| Total non-current liabilities | 8,227 | 12,688 | 1,755 | |||||
| TOTAL LIABILITIES | 271,591 | 268,094 | 37,128 | |||||
Shareholders’ equity: | ||||||||
| Class A ordinary shares | 116 | 116 | 16 | |||||
| Class B ordinary shares | 21 | 21 | 3 | |||||
| Additional paid-in capital | 4,849,337 | 4,918,718 | 681,235 | |||||
| Treasury stock | (65,896 | ) | (65,896 | ) | (9,126 | ) | ||
| Accumulated deficits | (3,853,635 | ) | (3,975,184 | ) | (550,557 | ) | ||
| Accumulated other comprehensive loss | (161,533 | ) | (160,943 | ) | (22,290 | ) | ||
| Total shareholders’ equity | 768,410 | 716,832 | 99,281 | |||||
| TOTAL LIABILITIES AND SHAREHOLDERS’ EQUITY | 1,040,001 | 984,926 | 136,409 | |||||
| Burning Rock Biotech Limited Unaudited Condensed Statements of Cash Flows (in thousands) | ||||||||
| For the three months ended | ||||||||
| March 31, 2023 | March 31, 2024 | March 31, 2024 | ||||||
| RMB | RMB | US$ | ||||||
| Net cash used in operating activities | (113,143 | ) | (40,209 | ) | (5,569 | ) | ||
| Net cash used in investing activities | (4,059 | ) | (2,386 | ) | (330 | ) | ||
| Net cash used in financing activities | (32 | ) | - | - | ||||
| Effect of exchange rate on cash, cash equivalents and restricted cash | (4,892 | ) | 53 | 7 | ||||
| Net decrease in cash, cash equivalents and restricted cash | (122,126 | ) | (42,542 | ) | (5,892 | ) | ||
| Cash, cash equivalents and restricted cash at the beginning of period | 925,268 | 615,216 | 85,206 | |||||
| Cash, cash equivalents and restricted cash at the end of period | 803,142 | 572,674 | 79,314 | |||||
| Burning Rock Biotech Limited Reconciliations of GAAP and Non-GAAP Results | |||||||||
| For the three months ended | |||||||||
| March 31, 2023 | June 30, 2023 | September 30, 2023 | December 31, 2023 | March 31, 2024 | |||||
| (RMB in thousands) | |||||||||
| Gross profit: | |||||||||
| Central laboratory channel | 48,090 | 51,876 | 41,487 | 41,886 | 37,002 | ||||
| In-hospital channel | 34,409 | 33,353 | 35,459 | 12,910 | 39,192 | ||||
| Pharma research and development channel | 16,273 | 15,193 | 8,974 | 23,317 | 9,500 | ||||
| Total gross profit | 98,772 | 100,422 | 85,920 | 78,113 | 85,694 | ||||
| Add: depreciation and amortization: | |||||||||
| Central laboratory channel | 2,567 | 2,645 | 2,550 | 2,414 | 1,919 | ||||
| In-hospital channel | 2,582 | 2,637 | 2,751 | 2,728 | 1,524 | ||||
| Pharma research and development channel | 3,974 | 3,665 | 3,863 | 3,808 | 3,856 | ||||
| Total depreciation and amortization included in cost of revenues | 9,123 | 8,947 | 9,164 | 8,950 | 7,299 | ||||
| Non-GAAP gross profit: | |||||||||
| Central laboratory channel | 50,657 | 54,521 | 44,037 | 44,300 | 38,921 | ||||
| In-hospital channel | 36,991 | 35,990 | 38,210 | 15,638 | 40,716 | ||||
| Pharma research and development channel | 20,247 | 18,858 | 12,837 | 27,125 | 13,356 | ||||
| Total non-GAAP gross profit | 107,895 | 109,369 | 95,084 | 87,063 | 92,993 | ||||
| Non-GAAP gross margin: | |||||||||
| Central laboratory channel | 82.0% | 82.3% | 82.3% | 86.4% | 81.7% | ||||
| In-hospital channel | 71.7% | 66.9% | 70.1% | 54.3% | 70.9% | ||||
| Pharma research and development channel | 69.5% | 72.0% | 65.5% | 66.2% | 64.8% | ||||
| Total non-GAAP gross margin | 75.7% | 74.8% | 74.5% | 71.9% | 74.0% | ||||
A photo accompanying this announcement is available at https://www.globenewswire.com/NewsRoom/AttachmentNg/370e7914-309e-48a2-b52f-03fe37ffa17d

![]()