
Volatility has eased in recent days as the market digests the possibility of more rate cuts. However, volatility could rear its ugly head again at any time.
The VIX Index closed at 17.24 yesterday after hitting a high of 28 earlier in November, and briefly dropping below 16 this month.
If volatility rises again Long Straddles could work well, so today we’re taking a look at the Long Straddle Screener.
A long straddle is an advanced options strategy used when a trader is seeking to profit from a big move in either direction and / or an increase in implied volatility.
To execute the strategy, a trader would buy a call and a put with the following conditions:
- Both options must use the same underlying stock
- Both options must have the same expiration
- Both options must have the same strike price
Since it involves having to buy both a call and a put, the trader must pay two premiums up-front, which also happens to be the maximum possible loss.
The potential profit is theoretically unlimited, although the trade will lose money each day through time decay if a big move does not occur.
The position means you will start with a net debit and only profit when the underlying stock rises above the upper break-even point or falls below the lower break-even point.
Profits can be made with a smaller price move if the move happens early in the trade.
Let’s take a look at Barchart’s Long Straddle Screener for December 2nd. I have added a filter for Market Cap above 40b and total call volume above 2,000.
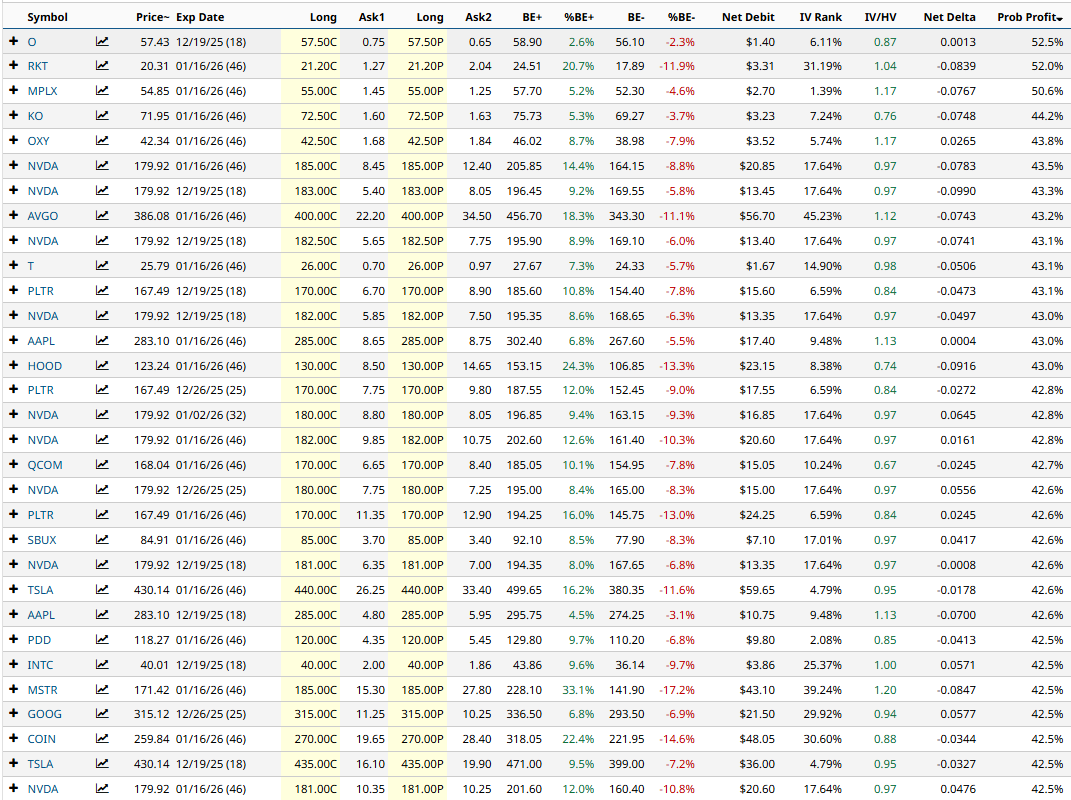
The screener shows some interesting long straddle trades on popular stocks such as KO, OXY, NVDA, AVGO, PLTR and HOOD. Let’s walk through a couple of examples.
KO Long Straddle Example
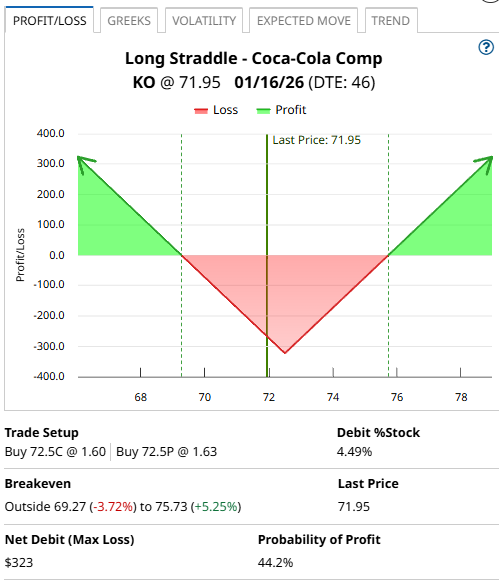
Let’s take a look at the fourth line item – a long straddle on KO.
Using the January 16th expiry, the trade would involve buying the $72.50-strike call and the $72.50-strike put. The premium paid for the trade would be $323, which is also the maximum loss. The maximum profit is theoretically unlimited. The lower breakeven price is $69.27 and the upper breakeven price is $75.73.
The premium paid is equal to 4.49% of the stock price and the probability of profit is estimated at 44.2%.
The Barchart Technical Opinion rating is a 56% Buy with a Weakening short term outlook on maintaining the current direction.
Implied volatility is currently 14.92% compared to a twelve-month low of 13.69% and a high of 30.61%.
OXY Long Straddle Example
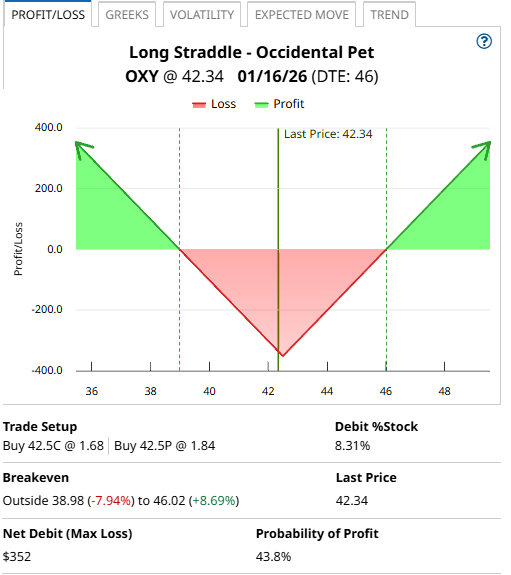
Let’s take a look at the fifth line item – a long straddle on OXY.
Also using the January 16th expiry, the trade would involve buying the $42.50-strike call and the $42.50-strike put. The premium paid for the trade would be $352, which is also the maximum loss. The maximum profit is theoretically unlimited. The lower breakeven price is $39.98 and the upper breakeven price is $46.02.
The premium paid is equal to 8.31% of the stock price and the probability of profit is estimated at 43.8%.
The Barchart Technical Opinion rating is a 88% Sell with a Weakening short term outlook on maintaining the current direction.
Long term indicators fully support a continuation of the trend.
Implied volatility is currently 27.30% compared to a twelve-month low of 24.14% and a high of 79.20%.
JPM Long Straddle Example
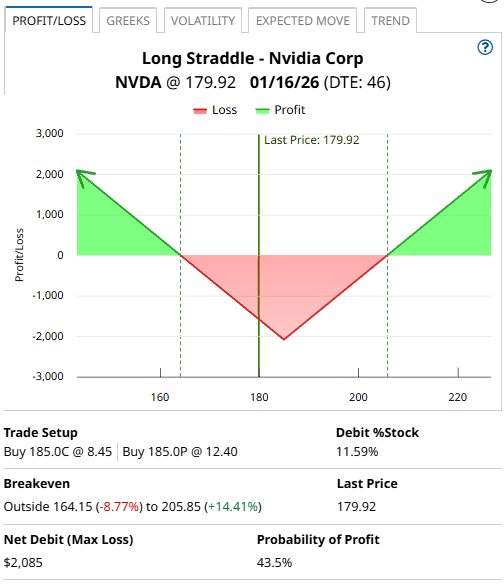
Let’s take a look at one final straddle, a long straddle on NVDA.
Using the January 16th expiry, the trade would involve buying the $185-strike call and the $185-strike put. The premium paid for the trade would be $2,085, which is also the maximum loss. The maximum profit is theoretically unlimited. The lower breakeven price is $164.15 and the upper breakeven price is $205.85.
The premium paid is equal to 11.59% of the stock price and the probability of profit is estimated at 43.5%.
The Barchart Technical Opinion rating is a 40% Buy with a Weakest short term outlook on maintaining the current direction.
Implied volatility is currently 39.47% compared to a twelve-month low of 31.73% and a high of 75.61%.
Mitigating Risk
Long straddles can lose money fairly quickly if the stock stay flat, and / or if implied volatility drops.
Position sizing is important so that a large loss does not cause more than a 1-2% loss in total portfolio value.
Another good rule of thumb is a 20-30% stop loss.
Please remember that options are risky, and investors can lose 100% of their investment. This article is for education purposes only and not a trade recommendation. Remember to always do your own due diligence and consult your financial advisor before making any investment decisions.
On the date of publication, Gavin McMaster had a position in: NVDA . All information and data in this article is solely for informational purposes. For more information please view the Barchart Disclosure Policy here.
More news from Barchart


