
The commodity complex in general is glowing red this first day of the new month, led by a sharp selloff in the Energies sector.
US Treasury futures are higher, but not by much, as the market continues to indicate the next US Fed Chair will immediately cut the Fed fund rate in June.
Don’t Miss a Day: From crude oil to coffee, sign up free for Barchart’s best-in-class commodity analysis.The Grains sector is in the red, mostly, with the background music in soybeans turned up to 11.
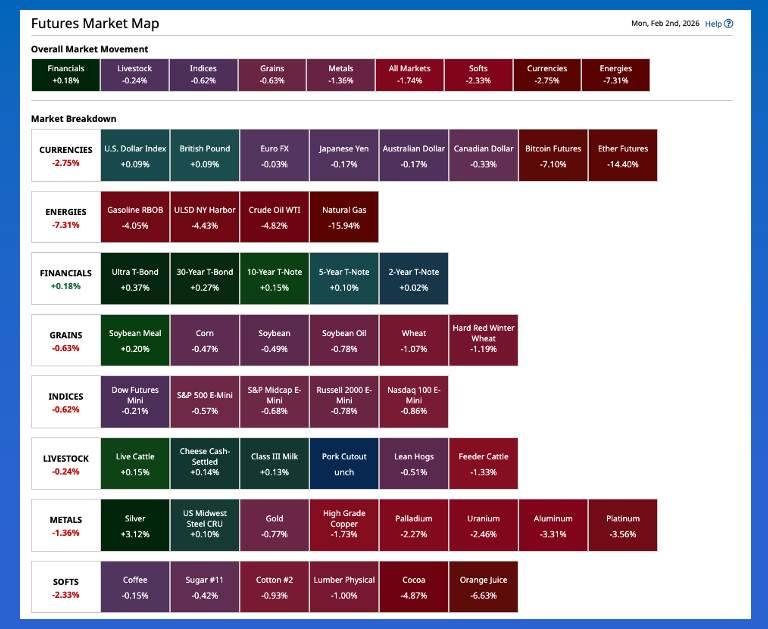
Morning Summary: There is a red glow coming from the commodity complex as February, the Dog Days of Winter (Summer in South America) gets under way. A look at the Barchart Futures Market Heat Map pre-dawn Monday and we see all sectors but Financials (US Treasury futures) in the red. Why are Treasury futures in the green? Most likely on follow-through buying from last Friday when the self-proclaimed President of Venezuela announced his choice for puppet to chair the US Federal Open Market Committee. A look at the Fed fund futures (ZQG26) forward curve to start the new month, though the next FOMC meeting isn’t until March, and we see the market continues to price in a June rate cut of 25-basis points. This should come as no surprise as the June meeting should be the first chaired by Kevin Warsh, aka Charlie Horse (of Sherry Lewis puppetry fame). On the other end of the Heat Map spectrum we find the Energies sector showing an average loss of 7.3%. Here we see all four major markets under heavy pressure, led by the always fun natural gas (NGH26) market (aka the Widow Maker) showing a loss of 15.9%. As for metals, Silver rebounded a bit from last Friday’s meltdown while gold remains under pressure.
Corn: Like most of the Grains sector, the corn market was in the red to start the day, week, and month. The March issue (ZCH26) posted a 3.75-cent trading range, all of it unchanged or lower, on an uptick in trade volume of 26,000 contracts and was sitting 1.75 cents lower at this writing. A look back at last Friday and we see March closed 2.5 cents lower after dropping as much as 5.5 cents over the course of the session. Recall, though, the carry in both the March-May and May-July futures spreads weakened heading into the weekend indicating commercial support. The National Corn Index closed January priced near $3.9475, down roughly 2.0 cents for the day meaning national average basis firmed Friday night. Still, the calculation came in at 33.5 cents under March futures, weaker than the previous 5-year low weekly close for last week of 32.25 cents under with the previous 10-year low weekly close for last week at 33.75 cents under March. The latest Commitments of Traders report (legacy, futures only) showed funds held a net-short futures position of 31,670 contracts as of Tuesday, January 27, a decrease of 20,030 contracts from the previous week. The Goldman Roll is scheduled to get under way this coming Friday.
Soybeans: The soybean market was also under pressure pre-dawn Monday. The March issue (ZSH26) lost as much as 12.5 cents overnight on trade volume of 22,500 contracts and was sitting 6.25 cents lower at this writing. If looking for a February theme song for US soybeans, a good choice would be R.E.M.’s “It’s the End of the World as We Know It (and I Feel Fine)”. By the time we reach the end of this month, the majority of Brazil’s 2026 soybean crop will be harvested and on its way to port. Thanks to that country’s benefactor, also the world’s largest soybean buyer, paying for an upgrade to infrastructure it doesn’t take trucks a month to get from field to port anymore. This means by the end of February there won’t be much interest in exporting US soybeans. My calculations show the US ships, on average, roughly 77% of what turns out to be its total export shipments for the marketing year by the end of this month, the midpoint of the marketing year. The latest weekly export sales and shipments update showed the US on pace to ship 1.146 bb, down 38% from last year’s reported shipments of 1.841 bb. Additionally, China still had 226 mb of unshipped sales on the books.
Wheat: The wheat sub-sector was in the red across the board to start the day, week, and month. All eyes will be on new-crop winter markets as we move more than a week past Winter Storm Fern blowing across the US Plains and Midwest growing areas. Recall there has been some chatter about winter kill in both winter wheat crops, HRW and SRW, a topic I usually find entertaining given a) Winter is in the name of both crops, it’s made for this time of year and b) Wheat’s nickname of “La Cucaracha of the Grains Sector” is well earned as it is hard to kill. Still, both sets of new-crop futures spreads have seen commercial support the past week or so with the July-September SRW spread closing last Friday covering 54% calculated full commercial carry as compared to the previous week’s 63% and same week the previous year at 58%. The HRW July-September spread still covered 64% versus the previous week’s 69% and previous year’s 74%. None of these numbers are bullish, but they aren’t overly bearish either. As of this writing the July SRW issue (ZWN26) is down 4.25 cents after sliding as much as 7.75 cents overnight while July HRW (KEN26) is off 6.0 cents pre-dawn.
On the date of publication, Darin Newsom did not have (either directly or indirectly) positions in any of the securities mentioned in this article. All information and data in this article is solely for informational purposes. For more information please view the Barchart Disclosure Policy here.
More news from Barchart
- How Is the Commodity Complex Starting the New Day, Week, and Month?
- Stocks Set to Open Lower as Risk Sentiment Weakens, U.S. Jobs Data and Earnings in Focus
- Golden Dome Missile Defense: What’s Next After $23B Approved Without a Plan?
- The British Are Coming! How to Play the Pound as the Dollar Stumbles.


