Infrastructure investment and operations firm FTAI Infrastructure (NASDAQ: FIP) fell short of the markets revenue expectations in Q3 CY2025, but sales rose 68.7% year on year to $140.6 million. Its GAAP loss of $1.38 per share was significantly below analysts’ consensus estimates.
Is now the time to buy FTAI Infrastructure? Find out by accessing our full research report, it’s free for active Edge members.
FTAI Infrastructure (FIP) Q3 CY2025 Highlights:
- Revenue: $140.6 million vs analyst estimates of $146.4 million (68.7% year-on-year growth, 4% miss)
- EPS (GAAP): -$1.38 vs analyst estimates of -$0.59 (significant miss)
- Operating Margin: -70.8%, down from -5.3% in the same quarter last year
- Free Cash Flow was -$90.71 million compared to -$12.08 million in the same quarter last year
- Market Capitalization: $606.5 million
Company Overview
Spun off from FTAI Aviation in 2021, FTAI Infrastructure (NASDAQ: FIP) invests in and operates infrastructure and related assets across the transportation and energy sectors.
Revenue Growth
A company’s long-term sales performance is one signal of its overall quality. Any business can have short-term success, but a top-tier one grows for years. Thankfully, FTAI Infrastructure’s 49.1% annualized revenue growth over the last four years was incredible. Its growth beat the average industrials company and shows its offerings resonate with customers.
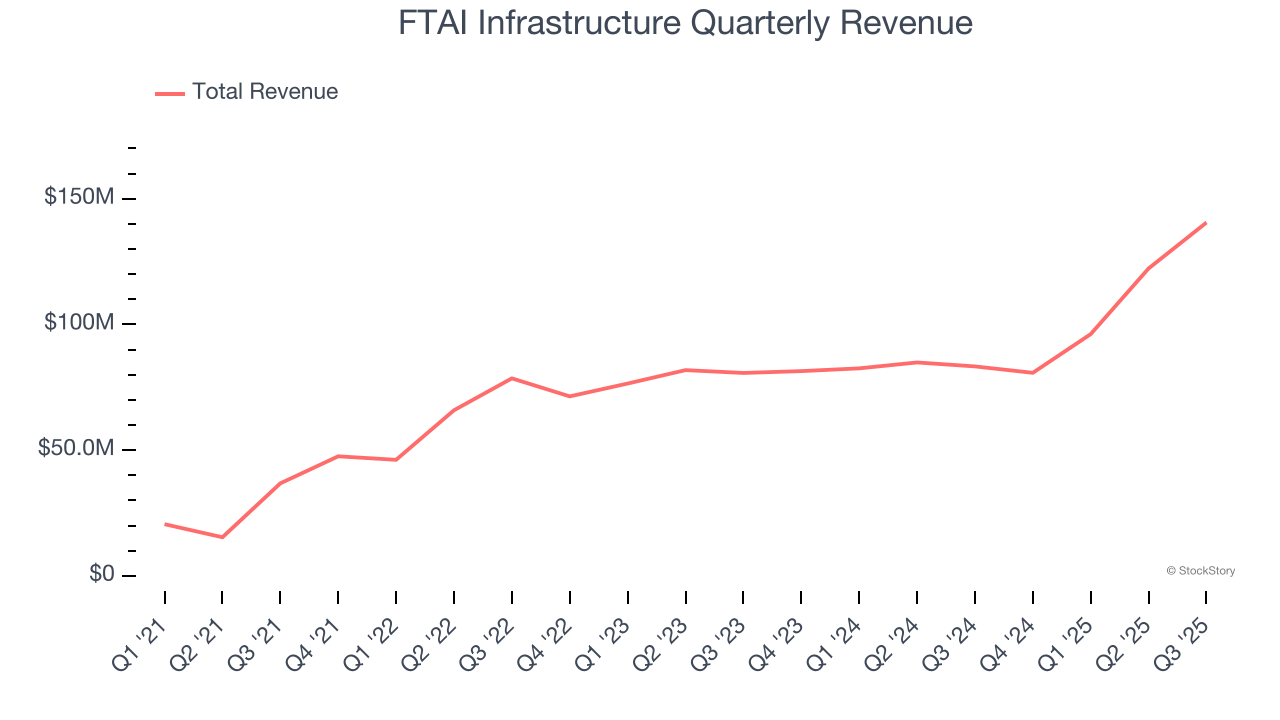
Long-term growth is the most important, but within industrials, a stretched historical view may miss new industry trends or demand cycles. FTAI Infrastructure’s annualized revenue growth of 19% over the last two years is below its four-year trend, but we still think the results suggest healthy demand. 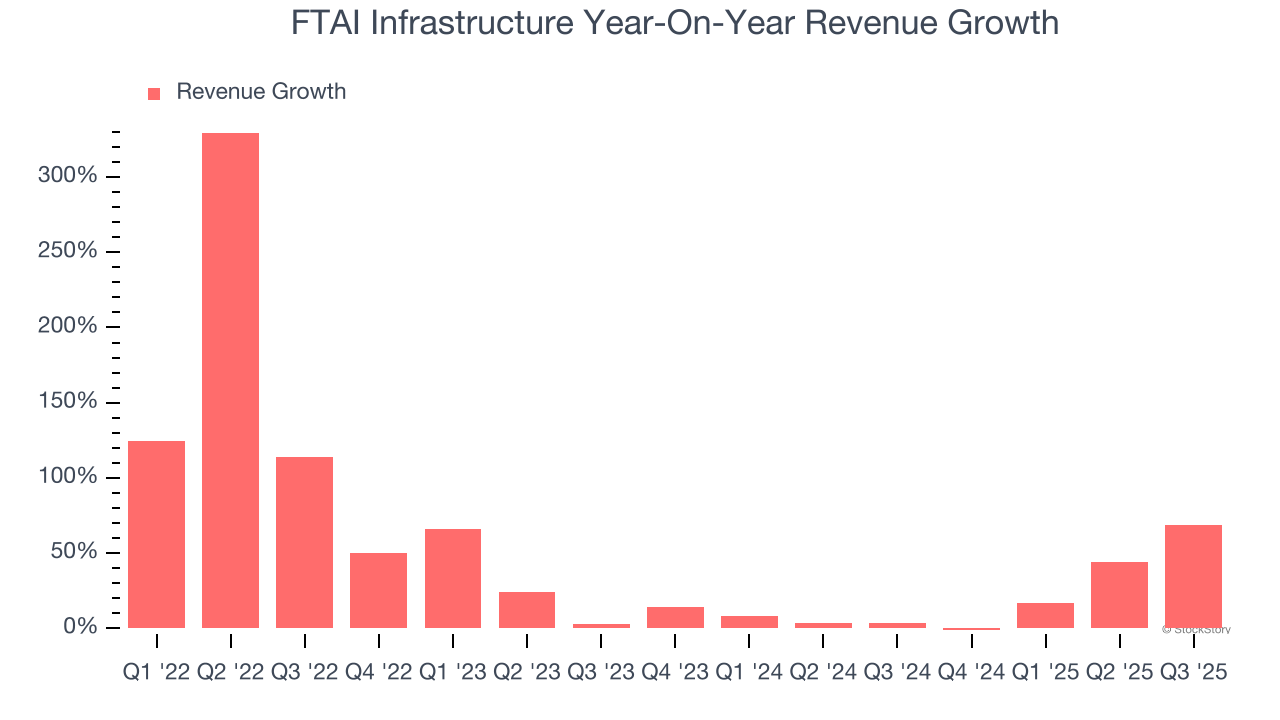
This quarter, FTAI Infrastructure achieved a magnificent 68.7% year-on-year revenue growth rate, but its $140.6 million of revenue fell short of Wall Street’s lofty estimates.
Looking ahead, sell-side analysts expect revenue to grow 75.1% over the next 12 months, an improvement versus the last two years. This projection is eye-popping and suggests its newer products and services will catalyze better top-line performance.
Today’s young investors won’t have read the timeless lessons in Gorilla Game: Picking Winners In High Technology because it was written more than 20 years ago when Microsoft and Apple were first establishing their supremacy. But if we apply the same principles, then enterprise software stocks leveraging their own generative AI capabilities may well be the Gorillas of the future. So, in that spirit, we are excited to present our Special Free Report on a profitable, fast-growing enterprise software stock that is already riding the automation wave and looking to catch the generative AI next.
Operating Margin
Operating margin is an important measure of profitability as it shows the portion of revenue left after accounting for all core expenses – everything from the cost of goods sold to advertising and wages. It’s also useful for comparing profitability across companies with different levels of debt and tax rates because it excludes interest and taxes.
FTAI Infrastructure’s high expenses have contributed to an average operating margin of negative 17% over the last five years. Unprofitable industrials companies require extra attention because they could get caught swimming naked when the tide goes out. It’s hard to trust that the business can endure a full cycle.
On the plus side, FTAI Infrastructure’s operating margin rose by 41.7 percentage points over the last five years, as its sales growth gave it operating leverage. Still, it will take much more for the company to reach long-term profitability.
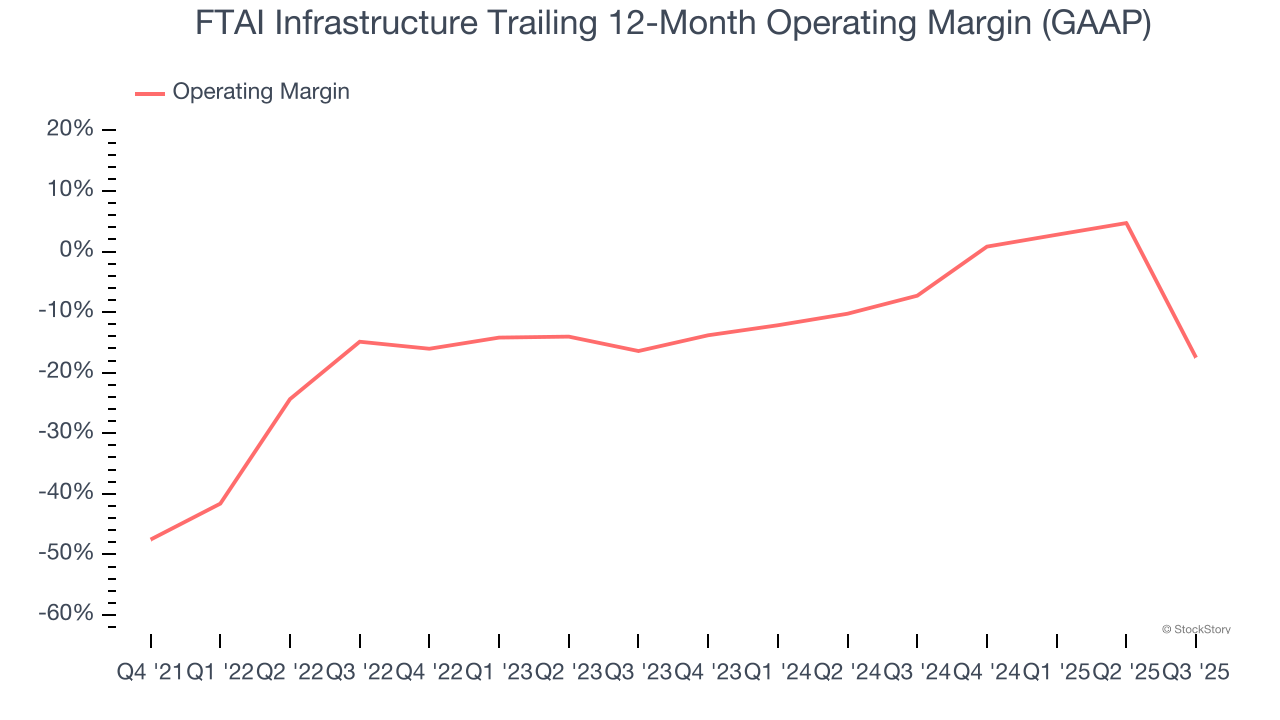
This quarter, FTAI Infrastructure generated a negative 70.8% operating margin.
Earnings Per Share
We track the long-term change in earnings per share (EPS) for the same reason as long-term revenue growth. Compared to revenue, however, EPS highlights whether a company’s growth is profitable.
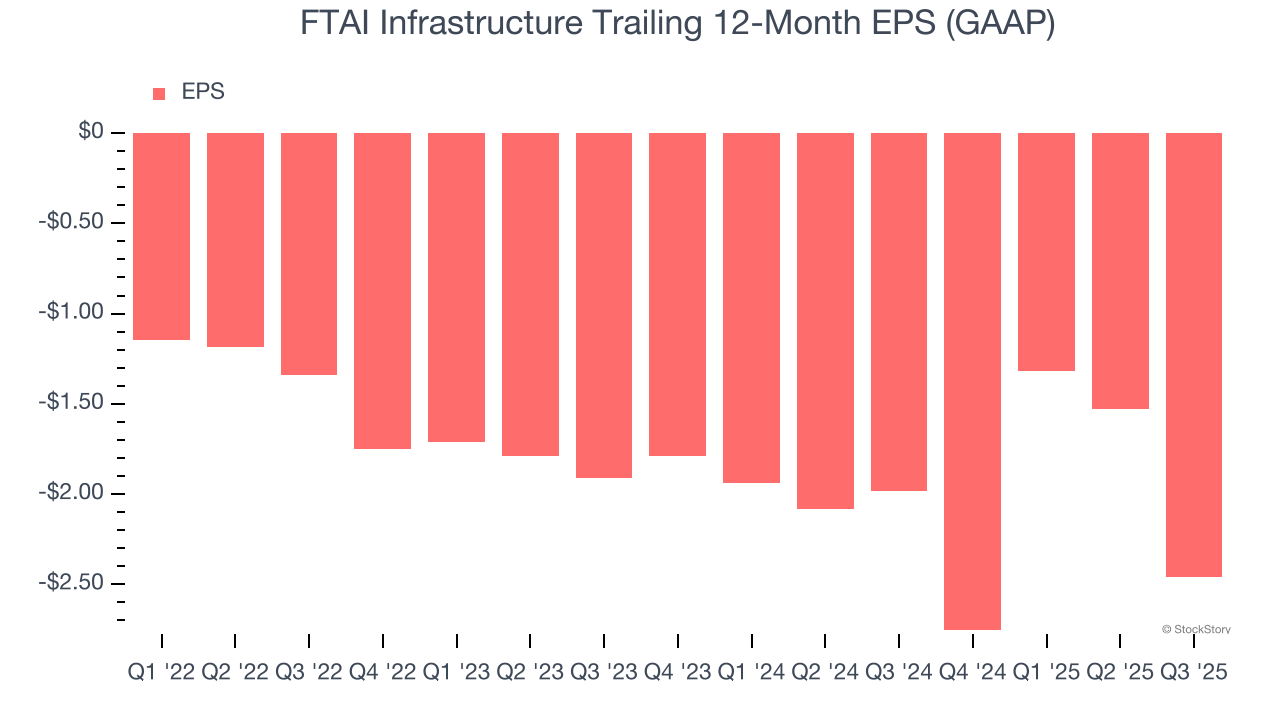
FTAI Infrastructure’s earnings losses deepened over the last four years as its EPS dropped 41% annually. We’ll keep a close eye on the company as diminishing earnings could imply changing secular trends and preferences.
Like with revenue, we analyze EPS over a more recent period because it can provide insight into an emerging theme or development for the business.
For FTAI Infrastructure, its two-year annual EPS declines of 13.5% show it’s still underperforming. These results were bad no matter how you slice the data, but given it was successful in other measures of financial health, we’re hopeful FTAI Infrastructure can generate earnings growth in the future.
In Q3, FTAI Infrastructure reported EPS of negative $1.38, down from negative $0.45 in the same quarter last year. This print missed analysts’ estimates. Over the next 12 months, Wall Street expects FTAI Infrastructure to improve its earnings losses. Analysts forecast its full-year EPS of negative $2.46 will advance to negative $1.36.
Key Takeaways from FTAI Infrastructure’s Q3 Results
This was an optically tough quarter as its revenue and EPS fell short of Wall Street’s estimates. However, the EPS miss was largely due to the one-time extinguishment of bad debt, causing EBITDA to nearly double to $71 million. The stock traded up 7.2% to $5.50 immediately following the results.
Big picture, is FTAI Infrastructure a buy here and now? When making that decision, it’s important to consider its valuation, business qualities, as well as what has happened in the latest quarter. We cover that in our actionable full research report which you can read here, it’s free for active Edge members.