The iShares U.S. Aerospace & Defense ETF (ITA) is currently operating as a high-stakes proxy for global stability. Or the lack of it. The fund is navigating a complex fundamental environment in which record-high defense budgets are clashing with production bottlenecks and shifting warfare tactics.
The fundamental case for a rebound in ITA rests on the normalization of high-intensity conflict. Global defense spending reached an estimated $2.7 trillion in late 2024, and the 2026 fiscal year has seen further increases, including a record $58 billion budget in Japan and a substantial annual rise in U.S. defense appropriations.
These are not cyclical spikes. They represent a structural reordering of national priorities. If ongoing conflicts in the Middle East or Eastern Europe remain unresolved or escalate in a way the market deems threatening to the post-war global order, the demand for ITA’s core holdings, which includes many mission-critical defense firms, becomes virtually inelastic.
Furthermore, the defense industry is at a strategic inflection point regarding technology. Modern battlefields have revealed that legacy platforms are increasingly vulnerable to low-cost autonomous systems and electronic warfare. This has forced a pivot toward greater and more rapid innovation. That, in turn, helps ITA’s portfolio of stocks.
A Closer Look at ITA
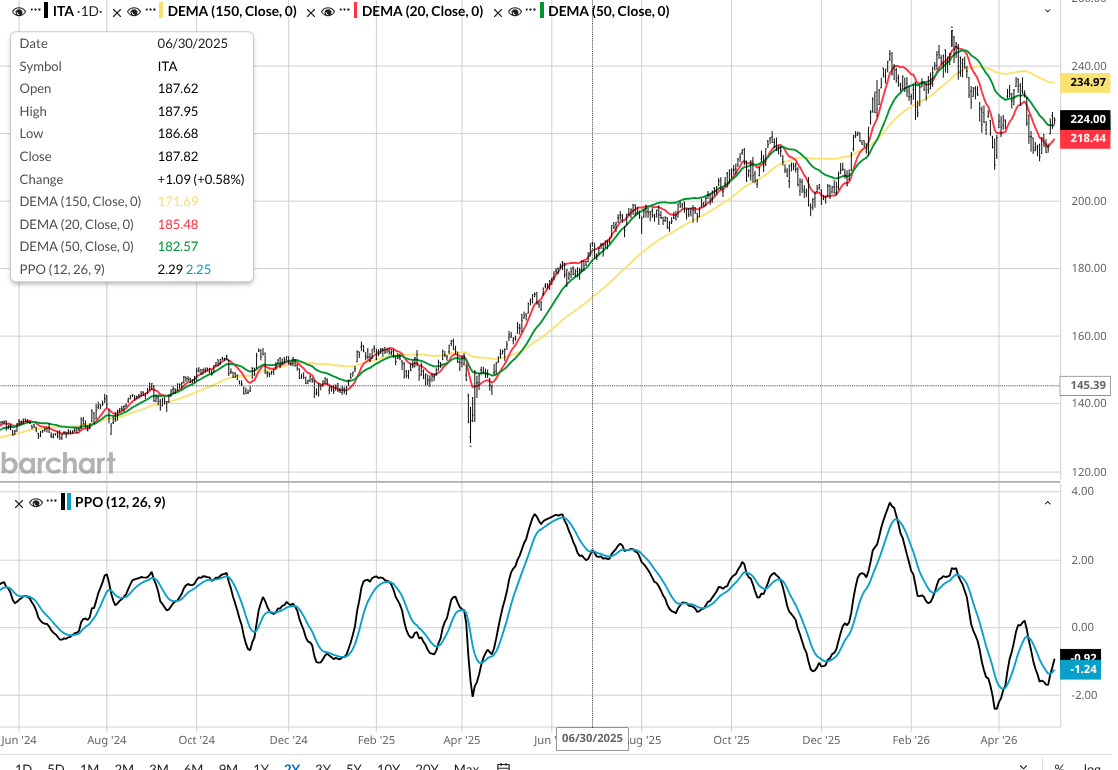
ITA’s daily chart indicates a trading range. But that could change quickly if a war thought to be entering a calming stage erupts once again. It certainly would not be the first time in this 2026 battle.
Of course, ITA is not without risks. Much of that relates to the industry's own capacity constraints. Despite surging demand, commercial backlogs now stretch beyond a decade, and persistent labor shortages in skilled trades — welders, electricians, and assemblers — are limiting the ability of manufacturers to increase output.
ITA has doubled over the past three years. But also during the past five years. Translation: 40% of the past five years saw zero return to ITA shareholders. Another reminder of the cyclical nature of stock market industries and of the market overall.
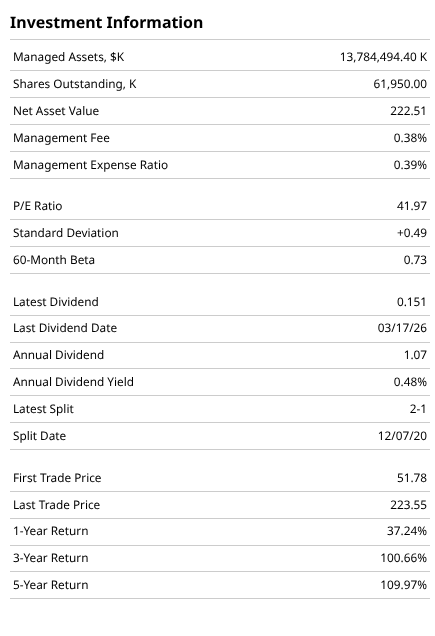
There is also the risk of a valuation disconnect. ITA currently carries a price-to-earnings (P/E) ratio significantly higher than historical averages. At more than 40x trailing earnings, it reflects a war premium that has already been priced in.
If diplomatic resolutions are reached or if the intensity of the geopolitical landscape cools unexpectedly, this premium could evaporate rapidly. In that scenario, the market would likely pivot back to focusing on the industry’s slow procurement cycles and high early career attrition rates.
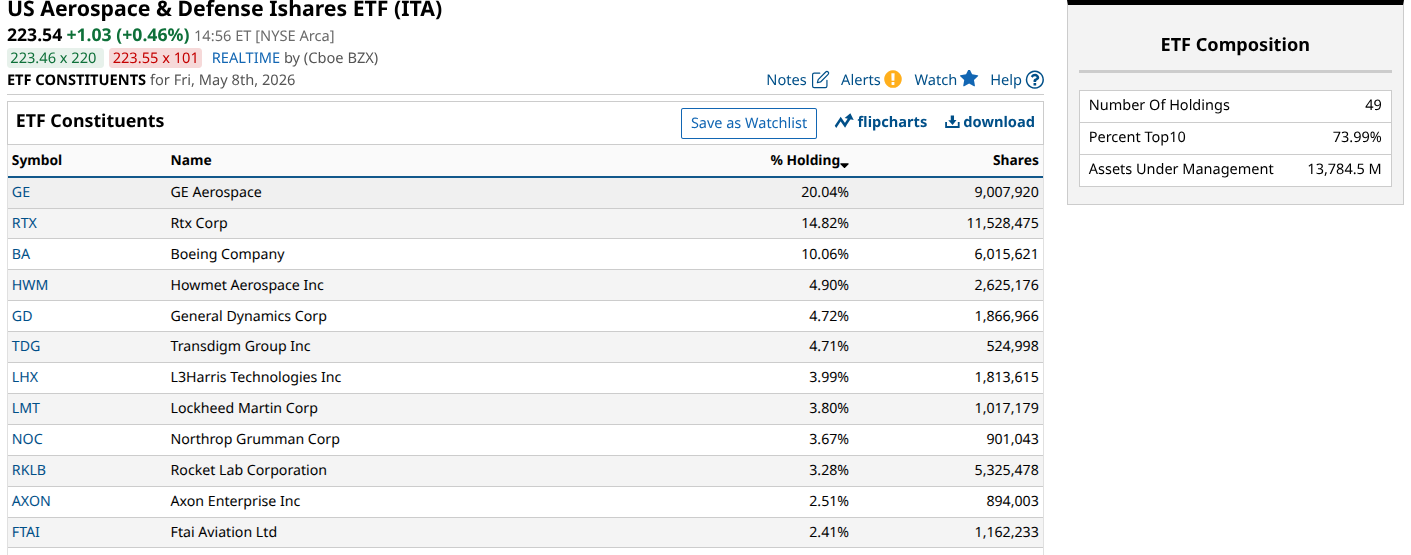
That would spell trouble for the stock prices of the above group, which, as you can see, is a concentrated mix. More than 70% of ITA’s total assets are in just 10 of its roughly 40 holdings. And the trio at the top represents nearly half of all assets.
The Bottom Line
Ultimately, ITA is a bet on the persistence of global tension. A rebound is fundamentally supported by the highest levels of government spending in decades, but it is tempered by an industrial base that is struggling to keep pace with its own order book. For the sector to move decisively higher, the industry must prove it can translate record-breaking appropriations into actual hardware delivery in an increasingly volatile world.
Rob Isbitts created the ROAR Score, based on his 40+ years of technical analysis experience. ROAR helps DIY investors manage risk and create their own portfolios. For Rob's written research, check out ETFYourself.com.
On the date of publication, Rob Isbitts did not have (either directly or indirectly) positions in any of the securities mentioned in this article. All information and data in this article is solely for informational purposes. For more information please view the Barchart Disclosure Policy here.
More news from Barchart
- If the Iran War Doesn’t End Soon, Be Ready for This ETF to Explode Higher Again
- The QQQ ETF Has Summited a Very Large Mountain. Make Sure You’re Ready for When It Climbs Back Down.
- Wall Street Is Bullish on These 2 Asia ETFs. It’s Time to Party Like It’s the 1980s.
- Solar ETFs Are Shockingly Cheap Now. Politics Will Decide If They’ll Burn You to a Crisp.