Menu
home
about us
Investment Approach
Client Service Approach
Market Analysis Summary
Mission Statement
Value Proposition
Team Biographies
Firm ADV PDFs
Form CRS
Firm Brochure-Part 2A of Form ADV
Brochure Supplement Amit Stavinsky
Brochure Supplement Frank Parks
Brochure Supplement Dominick Savo
Brochure Supplement Richard Mason
Brochure Supplement Joe Estes
Brochure Supplement Jonathan Ezra
Statement Of Financial Strength
Job Opportunities
Tamar Advisors
Own Your Practice
Letter to Clients
member log-in
contact us
PRODUCTS
Fixed Income Portfolio (FIP)
FIP Program
Services, Fees and Compensation
Client Information
Client Contact with Portfolio Manager(s)
Sample Portfolio
Back Dated Performance Reports
Quarterly Performance Reports
Total Asset Market (TAM)
TAM sm Program
Services, Fees and Compensation
Client Information
Client Contact with Portfolio Manager(s)
Sample Portfolio
Back Dated Performance Reports
Quarterly Performance Reports
Total Asset Fund (TAF)
TAF sm Program
Services, Fees and Compensation
Client Information
Client Contact with Portfolio Manager(s)
Sample Portfolio
Back Dated Performance Reports
Quarterly Performance Reports
Market Value Securities (MVS)
MVS Program
Services, Fees and Compensation
Client Information
Client Contact with Portfolio Manager(s)
Sample Portfolio
Back Dated Performance Reports
Quarterly Performance Reports
Total Asset Value (TAV)
TAV Program
Services, Fees and Compensation
Client Information
Client Contact with Portfolio Manager(s)
Sample Portfolio
Back Dated Performance Reports
Quarterly Performance Reports
Municipal Bonds
Taxable Bonds
Par, Premium, and Discount Bonds
Rating and Analyzing Bonds
Refunding & Pre-refunding
Bond Yields
Yield Curve
Secured Bonds
Mortgage Bonds
Unsecured Bonds
Debentures
Subordinated Debentures
Zero-Coupon Bonds
Convertible Bonds
High Yield Dividend Stocks
Independent Money Managers
Fees & Compensation
Corporate Cash Management
Fees & Compensation
Estate Planning
Financial Planning
Client Service Approach
Client's Responsibilities
Fees
Implementation
Legal Services
Termination
Professional Alliance Network
Client Service Approach
Client's Responsibilities
Fees
Implementation
Legal Services
Termination
MUNICIPAL BONDS
Municipal Bond Presentation
About Us
The Management
Global Asset Allocation Products
FIP Program
Classifying Municipal Bonds
Revenue Bonds
Credit Factors Affecting General Obligation Bonds
Credit Factors Affecting the Quality of Local Municipal Bonds
Analyzing the Credit Quality of General Obligation Bonds
Analyzing the Credit Quality of Revenue Municipal Bonds
What We Buy Currently
What We Normally Don’t Buy
Municipal Bonds – Unique Asset Class
Default Rates
Yield Difference
Turnkey Operation Platform
Advantages of Our Bid Wanted System
Advantages of Our Clearing System
Preferred Custodian Settlement
Advantages of Same-Day Allocation
TSL’s Turnkey Operation Platform
Sample Portfolio
Sample Portfolio Analysis
Classifying Municipal Bonds
Revenue Municipal Bonds
Types of Revenue Municipal Bonds
Industrial Development Revenue Bonds
Lease-back Bonds
Special Tax Bonds
NHA/PHA Bonds
Moral Obligation Bonds
Municipal Notes
TANs/RANs
BANs
CLNs/GANs
Variable Rate Bonds/Notes
Build America Bonds
Double-Barreled Bonds
Bond Index Components
Open-end-Closed-end-Indenture
Sinking Fund
Bond Contracts
Bond Indenture
Official Statement
Bond Issuance Process
Analyzing GO Bonds
Analyzing Revenue Bonds
Debt Ratios
General Price Analysis of Municipal Bonds
Liquidity
Interest Rate Risk
Credit Risk
Coupon Risk
Maturity Risk
Municipal Bond Insurance
Municipal Bonds Unique Asset Class
Default Rates
What We Buy Currently
What We Normally Don’t Buy
Turnkey Operation Platform
Advantages of Our Bid Wanted System
Advantages of Our Clearing System
Preferred Custodian Settlement
Advantages of Same Day Allocation
Traditional Broker/Dealer Execution Flow
TSL's Turnkey Operation Platform
INDEX FUNDS
Total Asset Fund (TAF)
TAF sm Program
Services, Fees and Compensation
Account Requirements
Client Information
Client Contact with Portfolio Manager(s)
Additional Information
Sample Portfolio
Back Dated Performance Reports
Quarterly Performance Reports
EVENTS
FIP
Event Schedule
Municipal Bond Presentation
TAM
Event Schedule
Total Asset Market (TAM sm) Presentation
TAF
Event Schedule
Total Asset Fund (TAF sm) Presentation
MVS
Event Schedule
Market Value Securities (MVS sm) Presentation
Featured Event
Calendar of Events
Events History
Investing During Uncertain Times
Read FULL Seminar Here
Tax-Free Income Seminar
Bond Fund Seminar
RSVP-Signup Form
MARKET RESEARCH
Featured Quarterly Newsletter
Featured Articles
Contrarian Notes Blog
home
about us
Investment Approach
Client Service Approach
Market Analysis Summary
Mission Statement
Value Proposition
Team Biographies
Firm ADV PDFs
Form CRS
Firm Brochure-Part 2A of Form ADV
Brochure Supplement Amit Stavinsky
Brochure Supplement Frank Parks
Brochure Supplement Dominick Savo
Brochure Supplement Richard Mason
Brochure Supplement Joe Estes
Brochure Supplement Jonathan Ezra
Statement Of Financial Strength
Job Opportunities
Tamar Advisors
Own Your Practice
Letter to Clients
member log-in
contact us
PRODUCTS
Fixed Income Portfolio (FIP)
FIP Program
Services, Fees and Compensation
Client Information
Client Contact with Portfolio Manager(s)
Sample Portfolio
Back Dated Performance Reports
Quarterly Performance Reports
Total Asset Market (TAM)
TAM sm Program
Services, Fees and Compensation
Client Information
Client Contact with Portfolio Manager(s)
Sample Portfolio
Back Dated Performance Reports
Quarterly Performance Reports
Total Asset Fund (TAF)
TAF sm Program
Services, Fees and Compensation
Client Information
Client Contact with Portfolio Manager(s)
Sample Portfolio
Back Dated Performance Reports
Quarterly Performance Reports
Market Value Securities (MVS)
MVS Program
Services, Fees and Compensation
Client Information
Client Contact with Portfolio Manager(s)
Sample Portfolio
Back Dated Performance Reports
Quarterly Performance Reports
Total Asset Value (TAV)
TAV Program
Services, Fees and Compensation
Client Information
Client Contact with Portfolio Manager(s)
Sample Portfolio
Back Dated Performance Reports
Quarterly Performance Reports
Municipal Bonds
Taxable Bonds
Par, Premium, and Discount Bonds
Rating and Analyzing Bonds
Refunding & Pre-refunding
Bond Yields
Yield Curve
Secured Bonds
Mortgage Bonds
Unsecured Bonds
Debentures
Subordinated Debentures
Zero-Coupon Bonds
Convertible Bonds
High Yield Dividend Stocks
Independent Money Managers
Fees & Compensation
Corporate Cash Management
Fees & Compensation
Estate Planning
Financial Planning
Client Service Approach
Client's Responsibilities
Fees
Implementation
Legal Services
Termination
Professional Alliance Network
Client Service Approach
Client's Responsibilities
Fees
Implementation
Legal Services
Termination
MUNICIPAL BONDS
Municipal Bond Presentation
About Us
The Management
Global Asset Allocation Products
FIP Program
Classifying Municipal Bonds
Revenue Bonds
Credit Factors Affecting General Obligation Bonds
Credit Factors Affecting the Quality of Local Municipal Bonds
Analyzing the Credit Quality of General Obligation Bonds
Analyzing the Credit Quality of Revenue Municipal Bonds
What We Normally Buy
What We Normally Don’t Buy
Municipal Bonds – Unique Asset Class
Default Rates
Yield Difference
Turnkey Operation Platform
Advantages of Our Bid Wanted System
Advantages of Our Clearing System
Preferred Custodian Settlement
Advantages of Same-Day Allocation
TSL’s Turnkey Operation Platform
Classifying Municipal Bonds
Revenue Municipal Bonds
Types of Revenue Municipal Bonds
Industrial Development Revenue Bonds
Lease-back Bonds
Special Tax Bonds
NHA/PHA Bonds
Moral Obligation Bonds
Municipal Notes
TANs/RANs
BANs
CLNs/GANs
Variable Rate Bonds/Notes
Build America Bonds
Double-Barreled Bonds
Bond Index Components
Open-end-Closed-end-Indenture
Sinking Fund
Bond Contracts
Bond Indenture
Official Statement
Bond Issuance Process
Analyzing GO Bonds
Analyzing Revenue Bonds
Debt Ratios
General Price Analysis of Municipal Bonds
Liquidity
Interest Rate Risk
Credit Risk
Coupon Risk
Maturity Risk
Municipal Bond Insurance
Municipal Bonds Unique Asset Class
Default Rates
What We Buy Currently
What We Normally Don’t Buy
Turnkey Operation Platform
Advantages of Our Bid Wanted System
Advantages of Our Clearing System
Preferred Custodian Settlement
Advantages of Same Day Allocation
Traditional Broker/Dealer Execution Flow
TSL's Turnkey Operation Platform
INDEX FUNDS
Total Asset Fund (TAF)
TAF® Program
Services, Fees and Compensation
Client Information
Client Contact with Portfolio Manager(s)
Additional Information
Sample Portfolio
Back Dated Performance Reports
Quarterly Performance Reports
EVENTS
FIP
Event Schedule
TAM
Event Schedule
Total Asset Market (TAM sm) Presentation
TAF
Event Schedule
Total Asset Fund (TAF sm) Presentation
MVS
Event Schedule
Market Value Securities (MVS sm) Presentation
Featured Event
Calendar of Events
Events History
Investing During Uncertain Times
Read FULL Seminar Here
Tax-Free Income Seminar
Bond Fund Seminar
RSVP-Signup Form
MARKET RESEARCH
Featured Quarterly Newsletter
Featured Articles
Contrarian Notes Blog
Recent Quotes
View Full List
My Watchlist
Create Watchlist
Indicators
DJI
Nasdaq Composite
SPX
Gold
Crude Oil
Markets
Stocks
ETFs
Tools
Markets:
Overview
News
Currencies
International
Treasuries
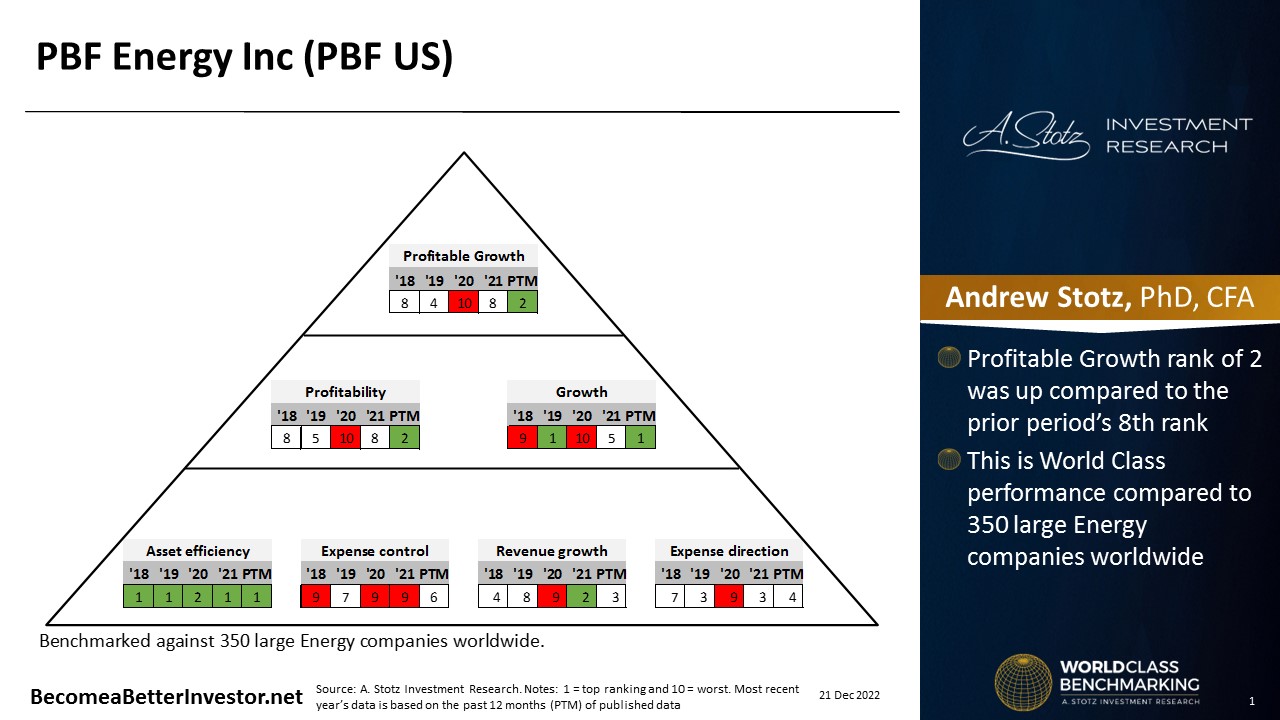
PBF Energy Inc. Class A Common Stock
(NY:
PBF
)
28.24
+1.01 (+3.71%)
Official Closing Price
Updated: 4:10 PM EST, Jan 7, 2026
Add to My Watchlist
Quote
Overview
Detailed Quote
Charting
Historical Prices
News
Press Releases
Research
Quarterly Reports
Insider Filings
Other Filings
All News about PBF Energy Inc. Class A Common Stock
< Previous
1
2
3
4
5
6
7
8
9
Next >
Best and Worst Performing Stocks Since Rate Hikes Began
↗
November 02, 2022
Looking at the S&P 1500, which includes large-caps, mid-caps, and small-caps, the average stock in the index is down 7.1% since the close on March 16th after the first rate hike.
Via
Talk Markets
PBF Energy Earnings Perspective: Return On Invested Capital
↗
October 31, 2022
Pulled from Benzinga Pro data, PBF Energy (NYSE:PBF) posted Q3 earnings of $1.08 billion, an increase from Q2 of 12.27%. Sales dropped to $12.77 billion, a 9.33% decrease between quarters.
Via
Benzinga
Recap: PBF Energy Q3 Earnings
↗
October 27, 2022
PBF Energy (NYSE:PBF) reported its Q3 earnings results on Thursday, October 27, 2022 at 06:12 AM. Here's what investors need to know about the announcement. Earnings PBF Energy beat estimated earnings...
Via
Benzinga
This Mid Cap Energy Stock is a 10-Bagger...And May Not Be Done
October 19, 2022
Let’s take a look at what PBF Energy does, why it's winning and why it could continue to raise eyebrows. Could we be in store for another magical performance?
Via
MarketBeat
Silver Drops Sharply; Owens & Minor Shares Slide
↗
October 12, 2022
U.S. stocks traded mostly higher toward the end of trading, following the release of PPI data for September.
Via
Benzinga
Expert Ratings for PBF Energy
↗
October 06, 2022
Within the last quarter, PBF Energy (NYSE:PBF) has observed the following analyst ratings:
Via
Benzinga
Recap: PBF Energy Q2 Earnings
↗
July 28, 2022
PBF Energy (NYSE:PBF) reported its Q2 earnings results on Thursday, July 28, 2022 at 06:30 AM. Here's what investors need to know about the announcement.
Via
Benzinga
Expert Ratings for PBF Energy
↗
July 05, 2022
Within the last quarter, PBF Energy (NYSE:PBF) has observed the following analyst ratings:
Via
Benzinga
Earnings Scheduled For October 27, 2022
↗
October 27, 2022
Companies Reporting Before The Bell • Janus Henderson Gr (NYSE:JHG) is expected to report quarterly earnings at $0.48 per share on revenue of $494.27 million.
Via
Benzinga
7 Small-Cap Stocks to Buy to Tap Into a Hidden Bull Market
↗
October 03, 2022
It's hard to consider small-cap stocks to buy in this terrible bear market, but there will come a day when a bull market takes hold.
Via
InvestorPlace
Darden Restaurants To Gain 7%? Here Are 5 Other Price Target Changes For Friday
↗
September 23, 2022
Wedbush raised the price target on Darden Restaurants, Inc. (NYSE: DRI) from $122 to $134. Wedbush analyst Nick Setyan maintained the stock with a Neutral rating. Darden shares fell 4.4% to close at...
Via
Benzinga
7 Top-Quality Stocks to Buy Before Q4
↗
September 22, 2022
Nothing says quality stocks like an "AAA" rating in the Portfolio Grader. Here are seven of the best stocks to buy that fit that description.
Via
InvestorPlace
Nasdaq Drops Over 100 Points; Spero Therapeutics Shares Spike Higher
↗
September 22, 2022
U.S. stocks traded lower midway through trading, with the Nasdaq Composite dropping more than 100 points on Thursday.
Via
Benzinga
US Stocks Open Lower As Dow Drops 100 Points
↗
September 22, 2022
U.S. stocks traded lower this morning, with the Dow Jones dropping around 100 points on Thursday.
Via
Benzinga
Benzinga's Top Ratings Upgrades, Downgrades For September 21, 2022
↗
September 21, 2022
Upgrades For Berkshire Hathaway Inc (NYSE:BRK), Edward Jones upgraded the previous rating of Hold to Buy. Berkshire Hathaway earned $6312.49 in the second quarter, compared to $4399.91 in the year-ago...
Via
Benzinga
Dow Dips 400 Points; Ford Shares Slide
↗
September 20, 2022
U.S. stocks traded lower toward the end of trading, with the Dow Jones dropping 400 points on Tuesday.
Via
Benzinga
Groupon, Spectrum Brands, Adobe And Other Big Losers From Thursday
↗
September 16, 2022
U.S. stocks closed lower with the Nasdaq 100 dropping around 200 points on Thursday. Here is the list of some big stocks recording losses in the previous session.
Via
Benzinga
Why ZW Data Action Technologies Jumped 37%; Here Are 71 Biggest Movers From Yesterday
↗
September 16, 2022
Gainers
Via
Benzinga
A Look Into Energy Sector Value Stocks
↗
September 15, 2022
What are Value Stocks? A value stock is traditionally defined in terms of how investors in the marketplace are valuing that company's future growth prospects. Low P/E multiples are good base indicators...
Via
Benzinga
Why Adobe Is Trading Lower By 17%, Here Are 49 Stocks Moving In Thursday's Mid-Day Session
↗
September 15, 2022
Gainers HeartBeam, Inc. (NASDAQ: BEAT) shares surged 58% to $1.96 after the company announced its patent for a 12-lead electrocardiogram patch monitor intended for detection of acute coronary syndrome...
Via
Benzinga
Analyst Ratings for PBF Energy
↗
September 15, 2022
Over the past 3 months, 4 analysts have published their opinion on PBF Energy (NYSE:PBF) stock. These analysts are typically employed by large Wall Street banks and tasked with understanding a...
Via
Benzinga
This Analyst Slashes Price Target On AMD, NVIDIA; Also Check Out Other Major PT Changes Here
↗
September 15, 2022
Mizuho cut the price target on NVIDIA Corporation (NASDAQ: NVDA) from $225 to $205. Mizuho analyst Vijay Rakesh maintained the stock with a Buy rating. NVIDIA shares rose 0.4% to $131.65 on Thursday.
Via
Benzinga
Benzinga's Top Ratings Upgrades, Downgrades For September 15, 2022
↗
September 15, 2022
Upgrades
Via
Benzinga
5 Value Stocks To Watch In The Energy Sector
↗
September 08, 2022
The Meaning Behind Value Stocks
Via
Benzinga
Baidu, Nikola And Some Other Big Stocks Moving Lower On Tuesday
↗
August 30, 2022
Photronics, Inc. (NASDAQ: PLAB) fell 23% to $16.76. Photronics posted upbeat Q3 results, but issued weak outlook for the current quarter.
Via
Benzinga
PBF LOGISTICS INVESTOR ALERT by the Former Attorney General of Louisiana: Kahn Swick & Foti, LLC Investigates Adequacy of Price and Process in Proposed Sale of PBF Logistics LP - PBFX
August 24, 2022
From
Kahn Swick & Foti, LLC
Via
Business Wire
Why Energy Stocks Traded Higher; Here Are 61 Biggest Movers From Yesterday
↗
July 26, 2022
Gainers GeoVax Labs, Inc. (NASDAQ: GOVX) jumped 150.4% to close at $1.59 on Monday after declining 8% on Friday.
Via
Benzinga
Zymergen, World Wrestling Entertainment And Some Other Big Stocks Moving Higher On Monday
↗
July 25, 2022
Via
Benzinga
These Were The Five Best And Worst Performing Mid-Cap Stocks In H1 2022
↗
July 24, 2022
Investors who want to make quick returns while having some stability amid the current volatile market environment can go for mid-cap stocks. Let’s take a look at the five best and worst performing...
Via
Talk Markets
United Airlines, American Airlines And Some Other Big Stocks Moving Lower On Thursday
↗
July 21, 2022
Insteel Industries, Inc. (NASDAQ: IIIN) fell 16.8% to $33.96 after the company posted weaker-than-expected Q3 results.
Via
Benzinga
< Previous
1
2
3
4
5
6
7
8
9
Next >
Stock Quote API & Stock News API supplied by
www.cloudquote.io
Quotes delayed at least 20 minutes.
By accessing this page, you agree to the
Privacy Policy
and
Terms Of Service
.
© 2025 FinancialContent. All rights reserved.