
Daredevil investors looking for a massive payout in the options market may want to consider Lennar Corp (LEN). As a homebuilder, Lennar has struggled amid a challenging economic environment mired by high prices and elevated borrowing costs. Circumstances got a bit uglier up until recently, when the market pegged very low odds for a December interest rate cut. However, an unexpected pivot may change the narrative for LEN stock.
On Monday, the U.S. dollar index slipped slightly lower amid dovish commentary from Federal Reserve policymakers. Specifically, Fed Governor Christopher Waller openly advocated for a rate cut next month. Subsequently, the odds of such a move occurring jumped to 80%. Just last Thursday, the probability was sitting at a paltry 30%. Not surprisingly, the accommodative shift in tone sent the major indices higher, with the S&P 500 gaining 1.55%.
Of course, it must be said that Lennar remains a tricky investment. Even with the broader enthusiasm, LEN stock actually slipped 0.16% on Monday. Since the start of the year, the equity is down 2.59%. Against the trailing 52 weeks, it’s down roughly 26%. Essentially, reduced costs of borrowing represent only one component of an incredibly complex housing environment.
However, what’s really interesting is that sentiment in the derivatives market seems to clash with the rumblings in the open market. Last week, net trade sentiment in Barchart’s options flow screener — which focuses exclusively on big block transactions — fell to $177,400 below parity on a cumulative basis. Enticingly, though, net trade sentiment on Monday was $130,600 in the positive.
To be sure, traders should be careful about being overly exposed to LEN stock. While I personally don’t pay much attention to such things, analysts’ assessment of Lennar is rather poor, with the homebuilder only managing a consensus Hold.
Basically, a Hold is what you give when you’re skeptical but diplomatic. It’s not exactly a ringing endorsement. Still, the real encouragement may not be in the fundamentals but in the quantitative arena.
Using Math to Plot the Probabilistic Structure of LEN Stock
While traditional methodologies of fundamental and technical analysis have their place in the financial publication realm, the central flaw is that the underlying concepts of undervaluation or mispricing stem from claims entirely dependent on the author. That’s not necessarily wrong as any statement about the future is automatically an opinion. Still, the key issue becomes a lack of empiricism.
Quantitative analysis, on the other hand, attempts to derive mispriced opportunities from asymmetries from the data itself. Moreover, I go a step further with a Kolmogorov-Markov framework layered with kernel density estimations (KM-KDE) to extract a metric known as probability density. Basically, probability density tells us the structure of a security’s behavioral pattern. Most importantly, this data subset identifies where prices are likely to cluster.
Extracting this information requires advanced algorithms and breaking apart price history into identical trials (I prefer 10 weeks and have been using this segmentation for quite some time). After hundreds, if not thousands of trials, recurring patterns start to emerge that may be exploited by opportunistic traders.
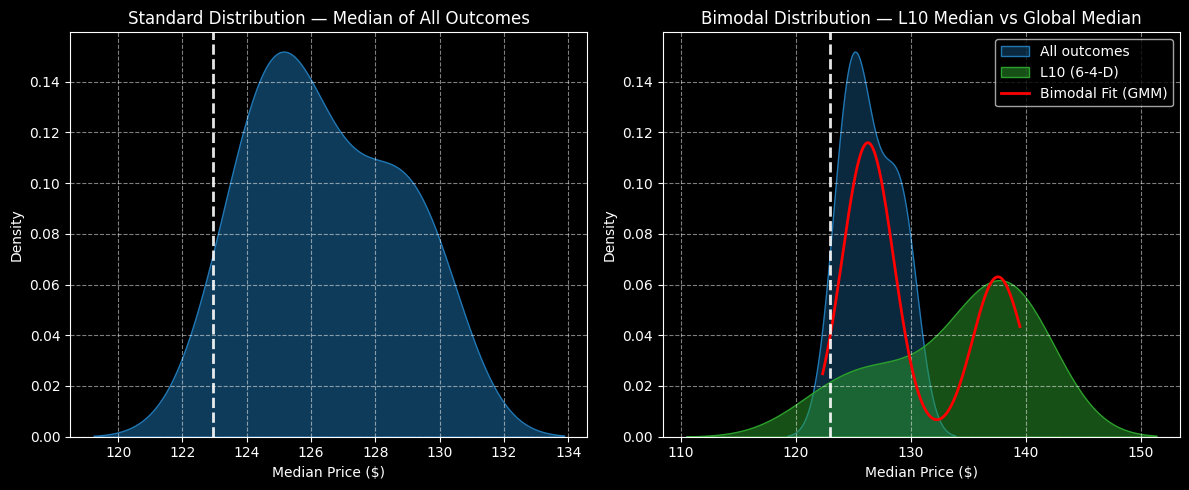
For example, the forward 10-week median returns of LEN stock can be arranged as a distributional curve using the KM-KDE approach mentioned above, with outcomes ranging between $119 and $134 (assuming an anchor price of $122.96, Monday’s close). Further, price clustering would likely be predominant around $125.
The above assessment aggregates all trials since January 2019. However, we’re interested in the statistical response to a specific signal, the 6-4-D; that is, in the trailing 10 weeks, LEN stock printed six up weeks and four down weeks, with an overall downward slope.
Under this setup, the forward 10-week returns would likely range between $110 and $152. Moreover, price clustering would likely materialize at approximately $137. As such, there’s a 9.6% positive variance in probability density dynamics, which effectively represents an informational arbitrage.
Most bullish traders would be looking for LEN stock to reach a median price of about $125 over the next 10 weeks. However, the quantitative framework suggests the median price could be closer to $140 over the next two months.
A Deal That Might Be Too Tempting to Ignore
Now that we know that under 6-4-D conditions, LEN stock may cluster around $137, arguably the most tempting vertical spread is the 135/140 bull call spread expiring Jan. 16, 2026. This trade requires two simultaneous transactions: buy the $135 call and sell the $140 call, for a net debit paid of $170 (the most that can be lost).
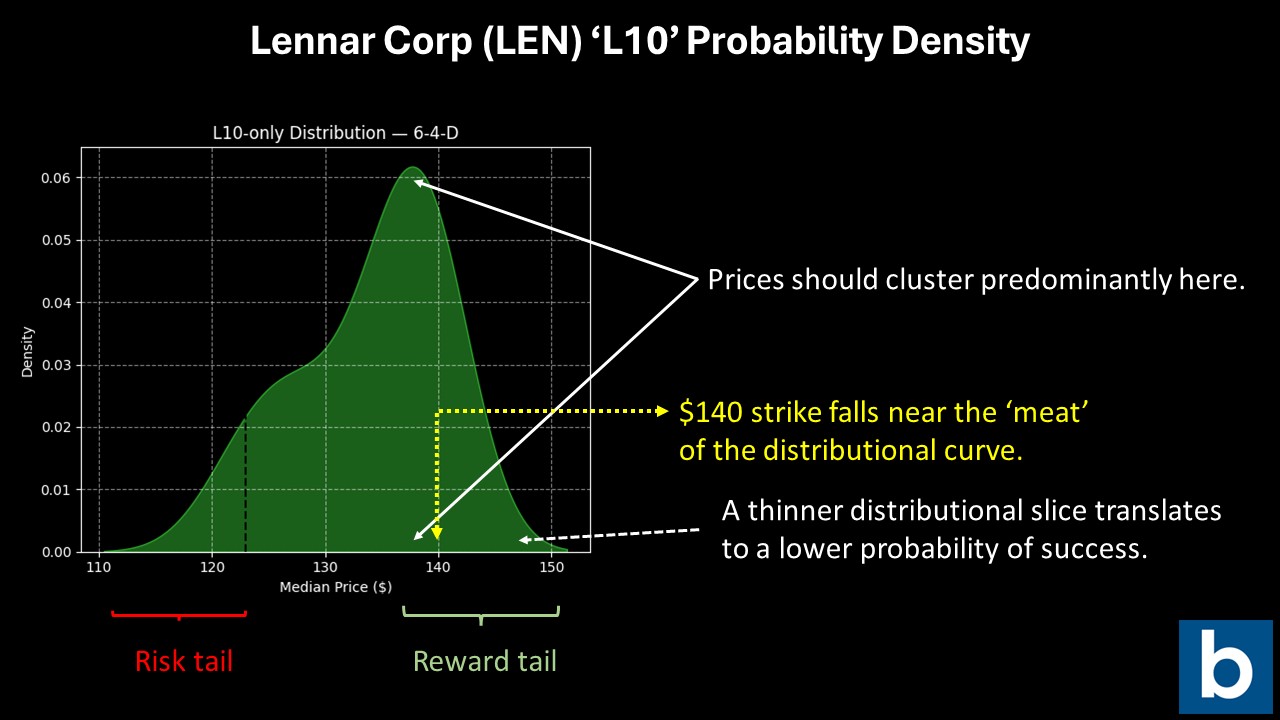
Should LEN stock rise through the second-leg strike ($140) at expiration, the maximum profit would be $330, a payout of over 194%. Further, breakeven would land at $136.70, which is right at the point where the distributional curve is the thickest.
Basically, we’re using the science of probability to help guide our decision. For example, the reason I’m not looking at strike prices beyond $150 is that it falls outside the expected distribution of outcomes. Unless I have a compelling reason to believe in an outsized performance, I’m going to stay within the curve — and on the thicker side at that.
On the date of publication, Josh Enomoto did not have (either directly or indirectly) positions in any of the securities mentioned in this article. All information and data in this article is solely for informational purposes. For more information please view the Barchart Disclosure Policy here.
More news from Barchart


