
Modular flooring manufacturer Interface (NASDAQ: TILE) beat Wall Street’s revenue expectations in Q3 CY2025, with sales up 5.9% year on year to $364.5 million. The company expects the full year’s revenue to be around $1.38 billion, close to analysts’ estimates. Its non-GAAP profit of $0.61 per share was 27.1% above analysts’ consensus estimates.
Is now the time to buy Interface? Find out by accessing our full research report, it’s free for active Edge members.
Interface (TILE) Q3 CY2025 Highlights:
- Revenue: $364.5 million vs analyst estimates of $357.3 million (5.9% year-on-year growth, 2% beat)
- Adjusted EPS: $0.61 vs analyst estimates of $0.48 (27.1% beat)
- Adjusted EBITDA: $66.2 million vs analyst estimates of $55.22 million (18.2% margin, 19.9% beat)
- The company slightly lifted its revenue guidance for the full year to $1.38 billion at the midpoint from $1.38 billion
- Operating Margin: 14.6%, up from 12.3% in the same quarter last year
- Free Cash Flow Margin: 18.1%, down from 20.3% in the same quarter last year
- Market Capitalization: $1.56 billion
“Third quarter results exceeded our expectations, as we delivered another period of strong year-over-year growth and meaningful profitability expansion. Currency-neutral net sales increased 4%, driven by continued share gains in the Americas and increased momentum in EAAA,” commented Laurel Hurd, CEO of Interface.
Company Overview
Pioneering carbon-neutral flooring since its founding in 1973, Interface (NASDAQ: TILE) is a global manufacturer of modular carpet tiles, luxury vinyl tile (LVT), and rubber flooring that specializes in carbon-neutral and sustainable flooring solutions.
Revenue Growth
A company’s long-term sales performance is one signal of its overall quality. Any business can put up a good quarter or two, but the best consistently grow over the long haul.
With $1.37 billion in revenue over the past 12 months, Interface is a small player in the business services space, which sometimes brings disadvantages compared to larger competitors benefiting from economies of scale and numerous distribution channels.
As you can see below, Interface’s 3.3% annualized revenue growth over the last five years was tepid. This shows it failed to generate demand in any major way and is a rough starting point for our analysis.
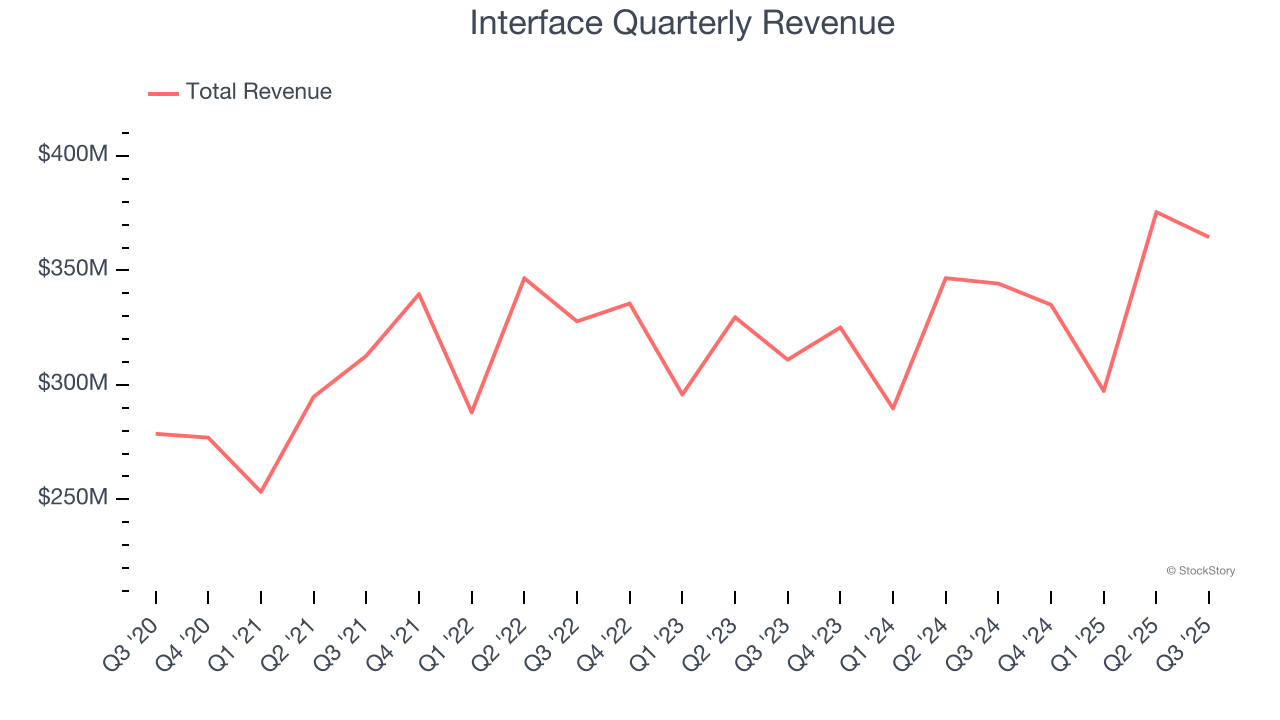
Long-term growth is the most important, but within business services, a half-decade historical view may miss new innovations or demand cycles. Interface’s annualized revenue growth of 3.9% over the last two years aligns with its five-year trend, suggesting its demand was consistently weak. 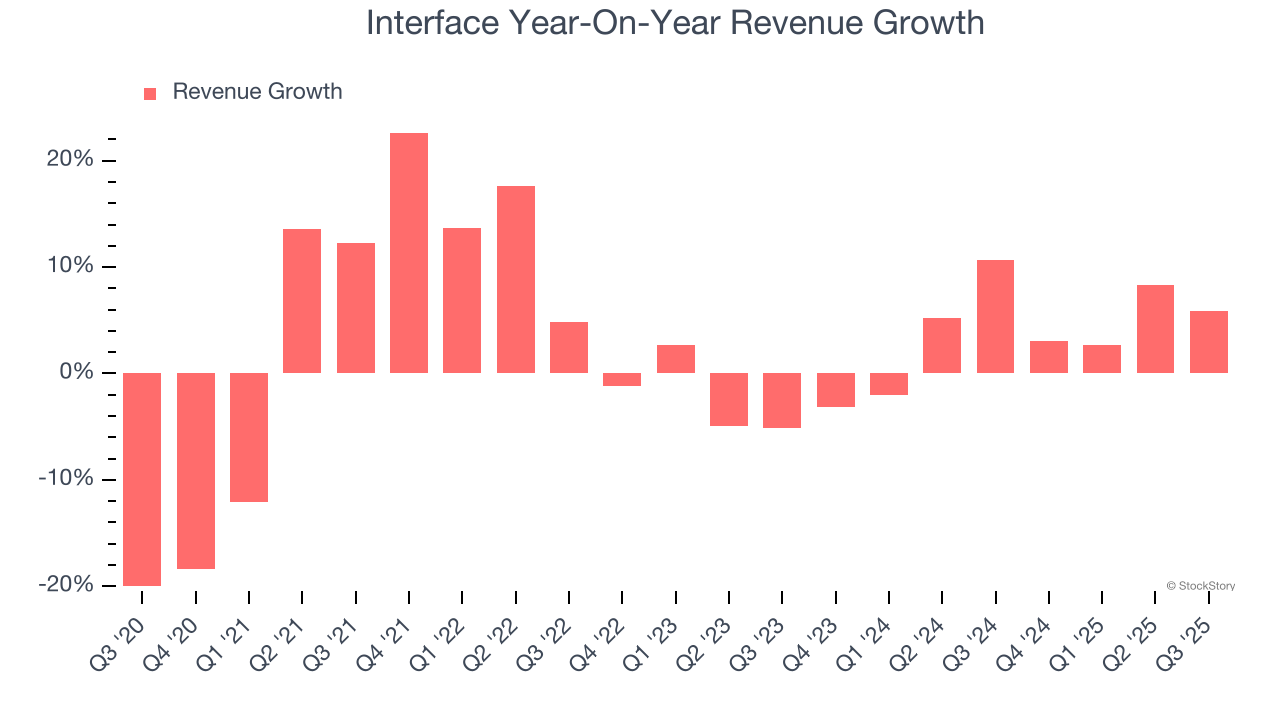
This quarter, Interface reported year-on-year revenue growth of 5.9%, and its $364.5 million of revenue exceeded Wall Street’s estimates by 2%.
Looking ahead, sell-side analysts expect revenue to grow 4.3% over the next 12 months, similar to its two-year rate. This projection is underwhelming and indicates its newer products and services will not catalyze better top-line performance yet.
Today’s young investors won’t have read the timeless lessons in Gorilla Game: Picking Winners In High Technology because it was written more than 20 years ago when Microsoft and Apple were first establishing their supremacy. But if we apply the same principles, then enterprise software stocks leveraging their own generative AI capabilities may well be the Gorillas of the future. So, in that spirit, we are excited to present our Special Free Report on a profitable, fast-growing enterprise software stock that is already riding the automation wave and looking to catch the generative AI next.
Operating Margin
Interface was profitable over the last five years but held back by its large cost base. Its average operating margin of 8.9% was weak for a business services business.
On the plus side, Interface’s operating margin rose by 3.5 percentage points over the last five years, as its sales growth gave it operating leverage.
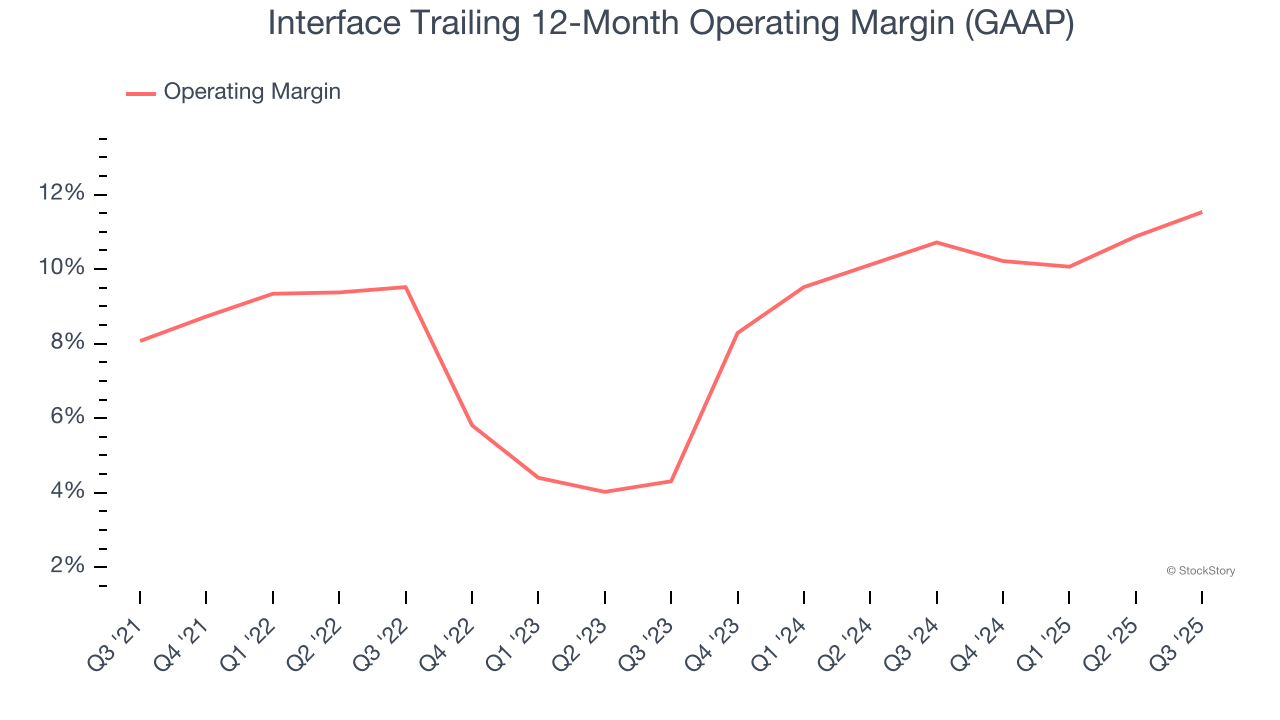
This quarter, Interface generated an operating margin profit margin of 14.6%, up 2.4 percentage points year on year. This increase was a welcome development and shows it was more efficient.
Earnings Per Share
We track the long-term change in earnings per share (EPS) for the same reason as long-term revenue growth. Compared to revenue, however, EPS highlights whether a company’s growth is profitable.
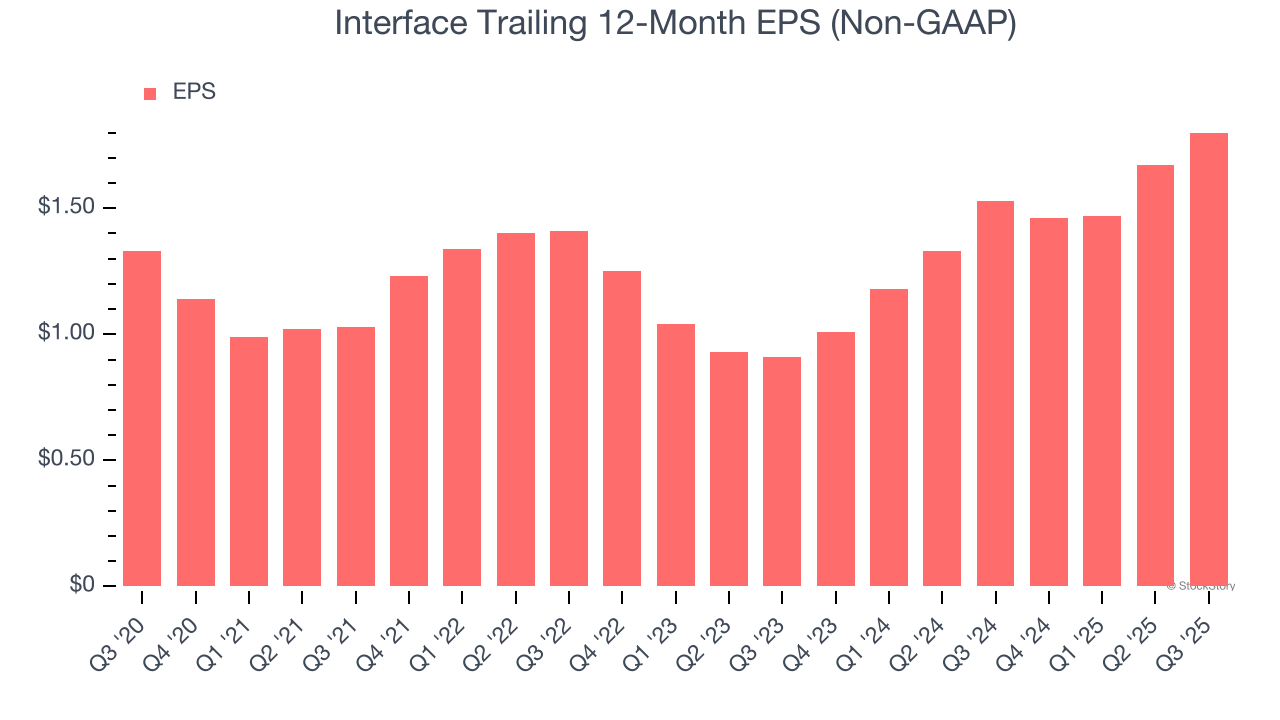
Interface’s EPS grew at an unimpressive 6.2% compounded annual growth rate over the last five years. On the bright side, this performance was better than its 3.3% annualized revenue growth and tells us the company became more profitable on a per-share basis as it expanded.
We can take a deeper look into Interface’s earnings to better understand the drivers of its performance. As we mentioned earlier, Interface’s operating margin expanded by 3.5 percentage points over the last five years. This was the most relevant factor (aside from the revenue impact) behind its higher earnings; interest expenses and taxes can also affect EPS but don’t tell us as much about a company’s fundamentals.
Like with revenue, we analyze EPS over a more recent period because it can provide insight into an emerging theme or development for the business.
For Interface, its two-year annual EPS growth of 40.6% was higher than its five-year trend. This acceleration made it one of the faster-growing business services companies in recent history.
In Q3, Interface reported adjusted EPS of $0.61, up from $0.48 in the same quarter last year. This print easily cleared analysts’ estimates, and shareholders should be content with the results. We also like to analyze expected EPS growth based on Wall Street analysts’ consensus projections, but there is insufficient data.
Key Takeaways from Interface’s Q3 Results
It was good to see Interface beat analysts’ EPS expectations this quarter and raise full-year EPS guidance. We were also happy its revenue outperformed Wall Street’s estimates. Overall, we think this was a solid quarter with some key areas of upside. The stock traded up 1.4% to $27 immediately after reporting.
Indeed, Interface had a rock-solid quarterly earnings result, but is this stock a good investment here? We think that the latest quarter is only one piece of the longer-term business quality puzzle. Quality, when combined with valuation, can help determine if the stock is a buy. We cover that in our actionable full research report which you can read here, it’s free for active Edge members.