When markets get choppy, candlesticks can feel overwhelming. There’s too much noise, too many wicks, and it’s hard to tell what the trend actually is.
That’s why traders turn to Renko charts — a bar type that filters out all of that noise, and focuses on one thing:
Price movement.
If you’ve ever struggled to see the true trend, Renko may be the missing piece of your charting toolkit. In this quick guide, we’ll break down how Renko charts work, when to use them, and how to set them up on Barchart’s Interactive Charts.
What Makes Renko Charts Different?
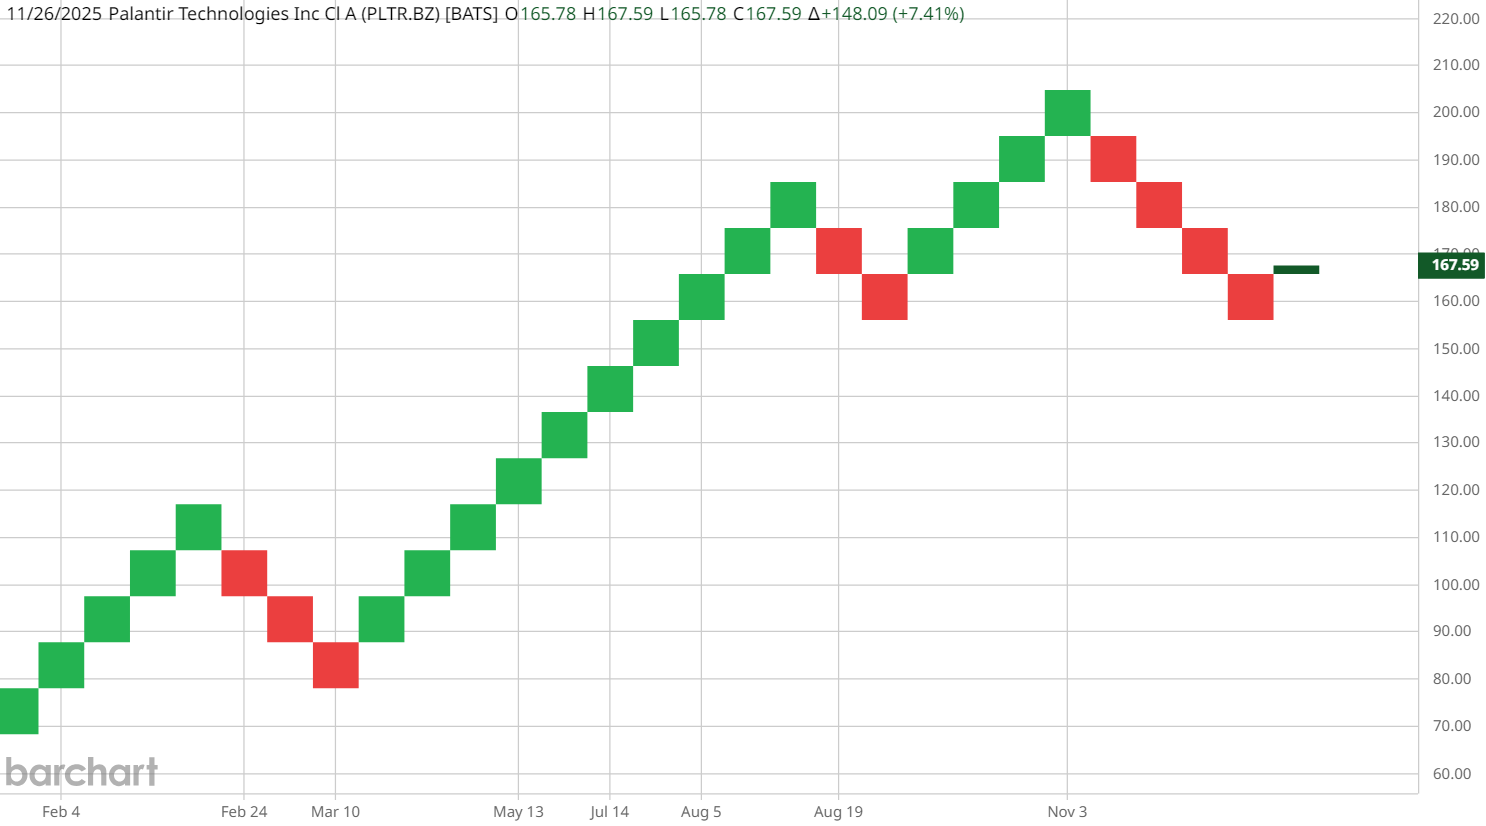
Unlike candlesticks (which print a new candle every time period), Renko only prints a brick when price moves a certain amount.
- Green brick = price moved up
- Red brick = price moved down
This makes Renko incredibly effective for:
✓ Identifying trend direction
✓ Eliminating noise
✓ Reducing false, “emotional” signals
✓ Avoiding getting chopped up in consolidation
Some bricks take hours to form. Some take days. Some take months.
It’s all based on price — not time.
Brick Size: The Engine Behind Renko
The most important setting is brick size. On Barchart, you can choose:
1. Fixed Dollar Brick Size (Traditional)
Example:
- $0.50 per brick
- $1.00 per brick
- $5.00 per brick
2. Percentage Brick Size
Brick forms when price moves a certain %.
3. ATR-Based Brick Size (Most Popular)
ATR automatically adjusts to volatility. The default on Barchart is a 14-period ATR.
- Higher volatility = larger bricks
- Lower volatility = smaller bricks
Smaller vs. Larger Brick Size
Smaller Bricks
- More swings
- More reversal signals
- Faster trend detection
- Better for short-term trading
Larger Bricks
- Smooth trend
- Fewer signals
- Better for long-term trading
- Less noise
Choosing brick size is personal, but the ATR default is a beginner-friendly starting point.
How to Use Renko Charts on Barchart
1. Open the Bar Type Selector → Choose Renko
This instantly converts your chart into a brick-based chart view.
2. Click “Settings” → Customize Brick Size
Switch between:
- ATR
- Traditional (fixed)
- Percentage
3. Add Indicators to Improve Signal Quality
Renko works best when paired with other technical indicators for confirmation, like:
- ADX (trend strength)
- RSI (momentum)
- Moving Averages (trend direction)
4. Save Your Setup as a Template
Chart templates allow you to use your Renko layout again instantly.
How Renko Helps You See Trends Faster
Renko filters out all price movements smaller than the chosen brick size.
That means:
- No chop
- No intraday noise
- Clearer breakouts
- Clearer reversals
If you want a chart that lets you follow the trend with more confidence, Renko is one of your best options.
To learn more charting techniques — including Heikin-Ashi, Hollow Candles, and more — check out Top Chart Types for Traders & Investors.
Watch the quick tutorial here → Renko Charts Beginner Guide
On the date of publication, Barchart Insights did not have (either directly or indirectly) positions in any of the securities mentioned in this article. All information and data in this article is solely for informational purposes. For more information please view the Barchart Disclosure Policy here.
More news from Barchart
- Marvell Stock Is Down 25% in 2025, and This Analyst Says Investors Should Stay Away from the MRVL Dip
- These Stock Charts Filter Out the Noise So You Can Focus on Price. Here’s What Trend Traders Need to Know.
- Cathie Wood Is Buying the Dip in BitMine Immersion Stock. Should You?
- Google Is Getting the AI Spotlight, But Nvidia Says Its GPUs Are a ‘Generation Ahead.’ How Should You Play NVDA Stock Here?


