Speciality vehicle provider REV (NYSE: REVG) announced better-than-expected revenue in Q1 CY2025, with sales up 2% year on year to $629.1 million. The company’s full-year revenue guidance of $2.4 billion at the midpoint came in 0.9% above analysts’ estimates. Its non-GAAP profit of $0.70 per share was 22.8% above analysts’ consensus estimates.
Is now the time to buy REV Group? Find out by accessing our full research report, it’s free.
REV Group (REVG) Q1 CY2025 Highlights:
- Revenue: $629.1 million vs analyst estimates of $596.7 million (2% year-on-year growth, 5.4% beat)
- Adjusted EPS: $0.70 vs analyst estimates of $0.57 (22.8% beat)
- Adjusted EBITDA: $58.9 million vs analyst estimates of $52.2 million (9.4% margin, 12.8% beat)
- EBITDA guidance for the full year is $210 million at the midpoint, above analyst estimates of $203.4 million
- Operating Margin: 7.9%, up from 3.7% in the same quarter last year
- Free Cash Flow Margin: 13.9%, up from 5.5% in the same quarter last year
- Backlog: $4.55 billion at quarter end
- Market Capitalization: $1.92 billion
Company Overview
Offering the first full-electric North American fire truck, REV (NYSE: REVG) manufactures and sells specialty vehicles.
Sales Growth
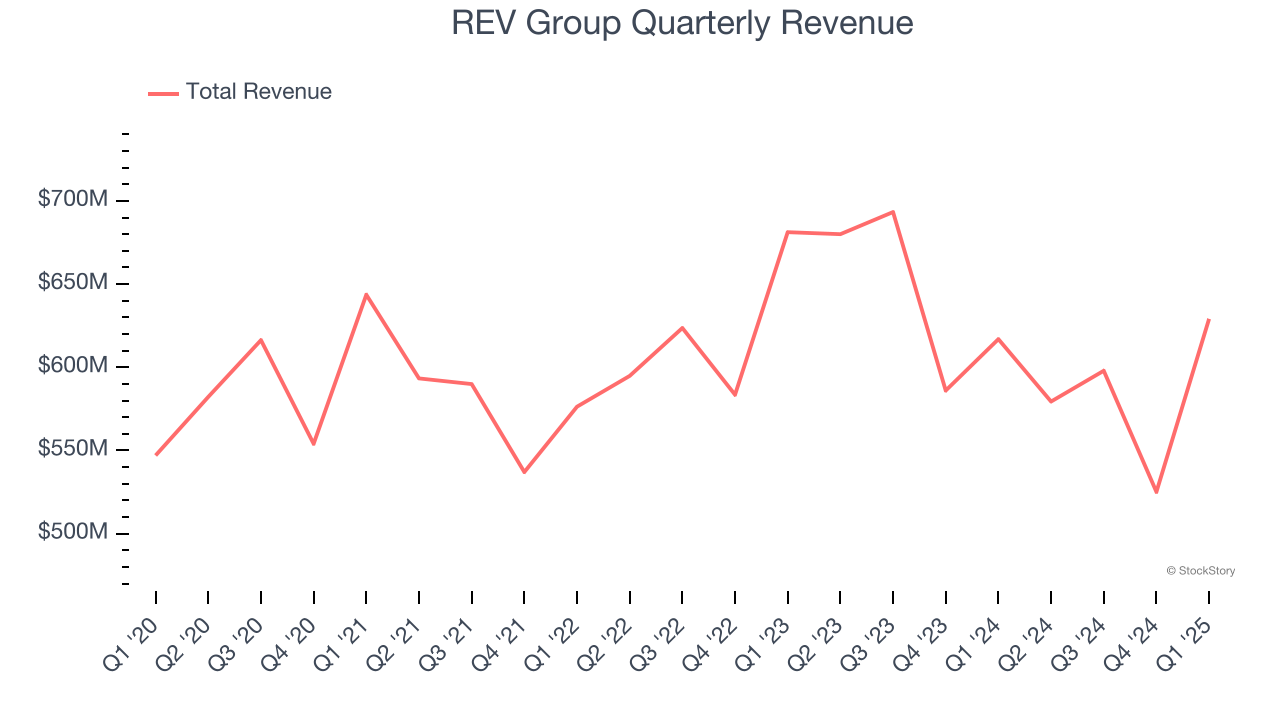
Reviewing a company’s long-term sales performance reveals insights into its quality. Any business can have short-term success, but a top-tier one grows for years. Unfortunately, REV Group struggled to consistently increase demand as its $2.33 billion of sales for the trailing 12 months was close to its revenue five years ago. This was below our standards and is a rough starting point for our analysis.
We at StockStory place the most emphasis on long-term growth, but within industrials, a half-decade historical view may miss cycles, industry trends, or a company capitalizing on catalysts such as a new contract win or a successful product line. REV Group’s recent performance shows its demand remained suppressed as its revenue has declined by 3.1% annually over the last two years. 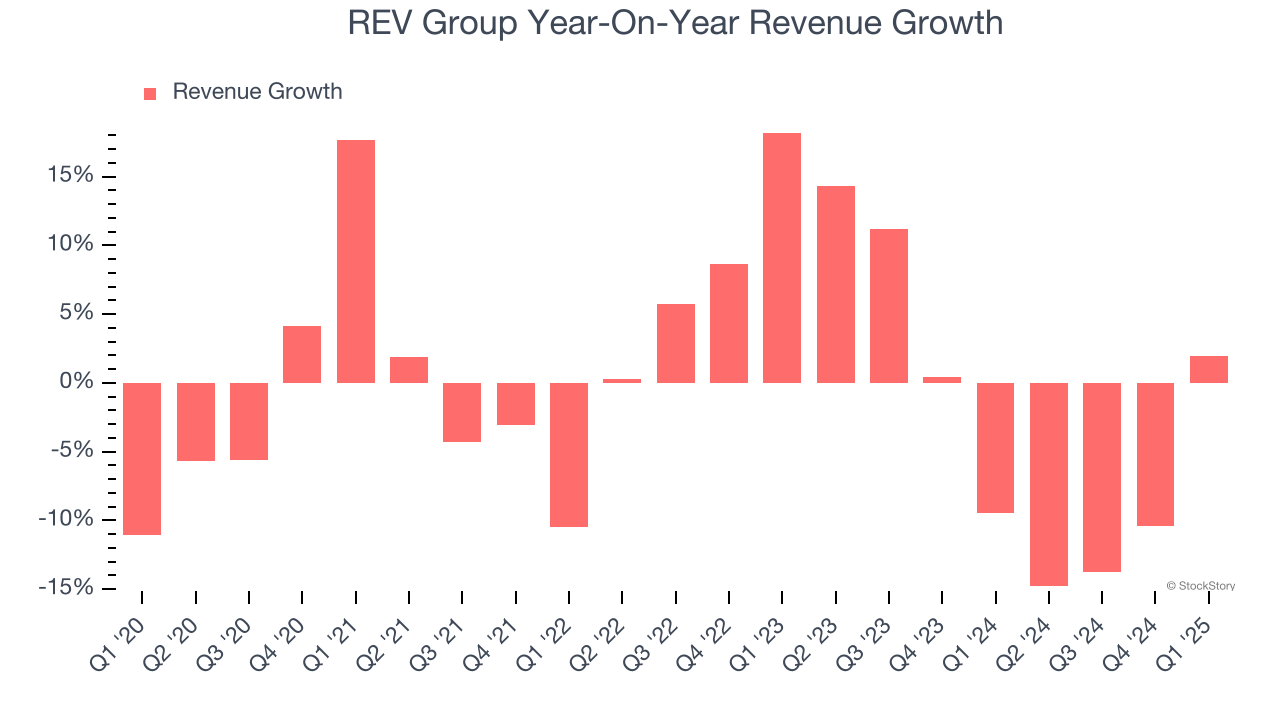
This quarter, REV Group reported modest year-on-year revenue growth of 2% but beat Wall Street’s estimates by 5.4%.
Looking ahead, sell-side analysts expect revenue to grow 4.6% over the next 12 months. Although this projection suggests its newer products and services will fuel better top-line performance, it is still below average for the sector.
Here at StockStory, we certainly understand the potential of thematic investing. Diverse winners from Microsoft (MSFT) to Alphabet (GOOG), Coca-Cola (KO) to Monster Beverage (MNST) could all have been identified as promising growth stories with a megatrend driving the growth. So, in that spirit, we’ve identified a relatively under-the-radar profitable growth stock benefiting from the rise of AI, available to you FREE via this link.
Operating Margin
Operating margin is an important measure of profitability as it shows the portion of revenue left after accounting for all core expenses – everything from the cost of goods sold to advertising and wages. It’s also useful for comparing profitability across companies with different levels of debt and tax rates because it excludes interest and taxes.
REV Group was profitable over the last five years but held back by its large cost base. Its average operating margin of 3% was weak for an industrials business. This result isn’t too surprising given its low gross margin as a starting point.
On the plus side, REV Group’s operating margin rose by 4.2 percentage points over the last five years.
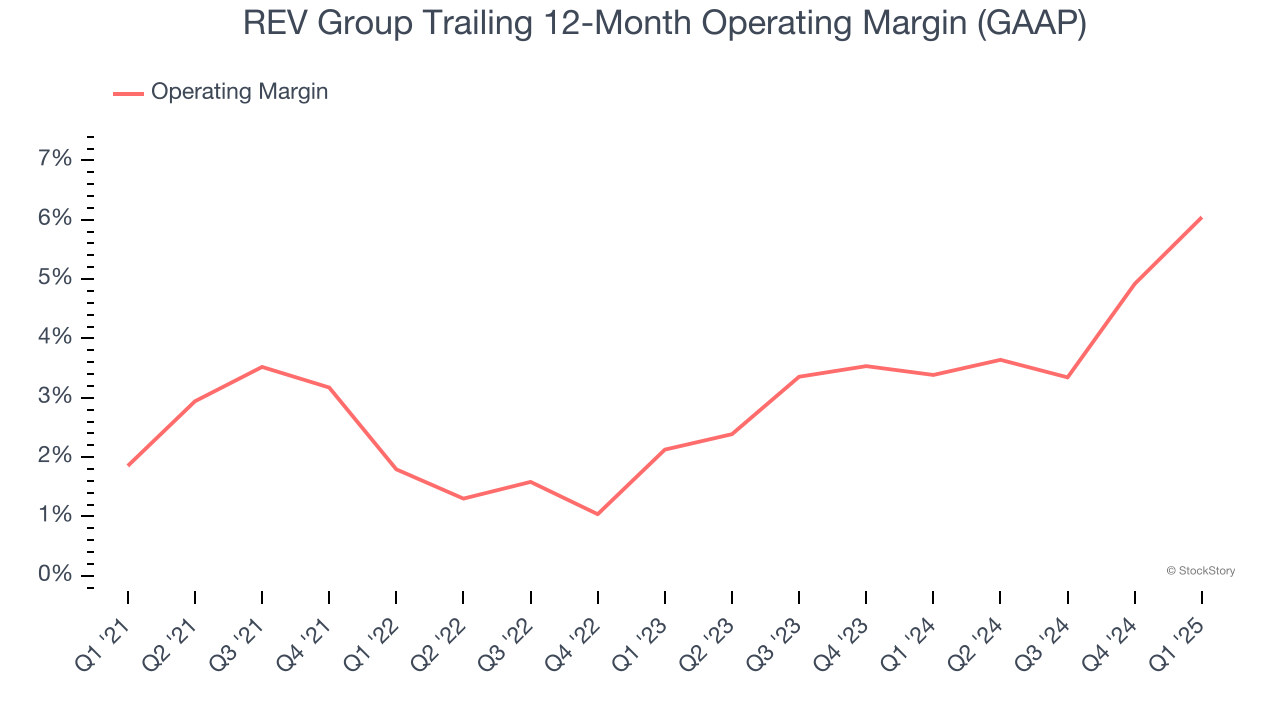
In Q1, REV Group generated an operating margin profit margin of 7.9%, up 4.2 percentage points year on year. The increase was encouraging, and because its operating margin rose more than its gross margin, we can infer it was more efficient with expenses such as marketing, R&D, and administrative overhead.
Earnings Per Share
We track the long-term change in earnings per share (EPS) for the same reason as long-term revenue growth. Compared to revenue, however, EPS highlights whether a company’s growth is profitable.
REV Group’s EPS grew at an astounding 74.3% compounded annual growth rate over the last five years, higher than its flat revenue. This tells us management responded to softer demand by adapting its cost structure.
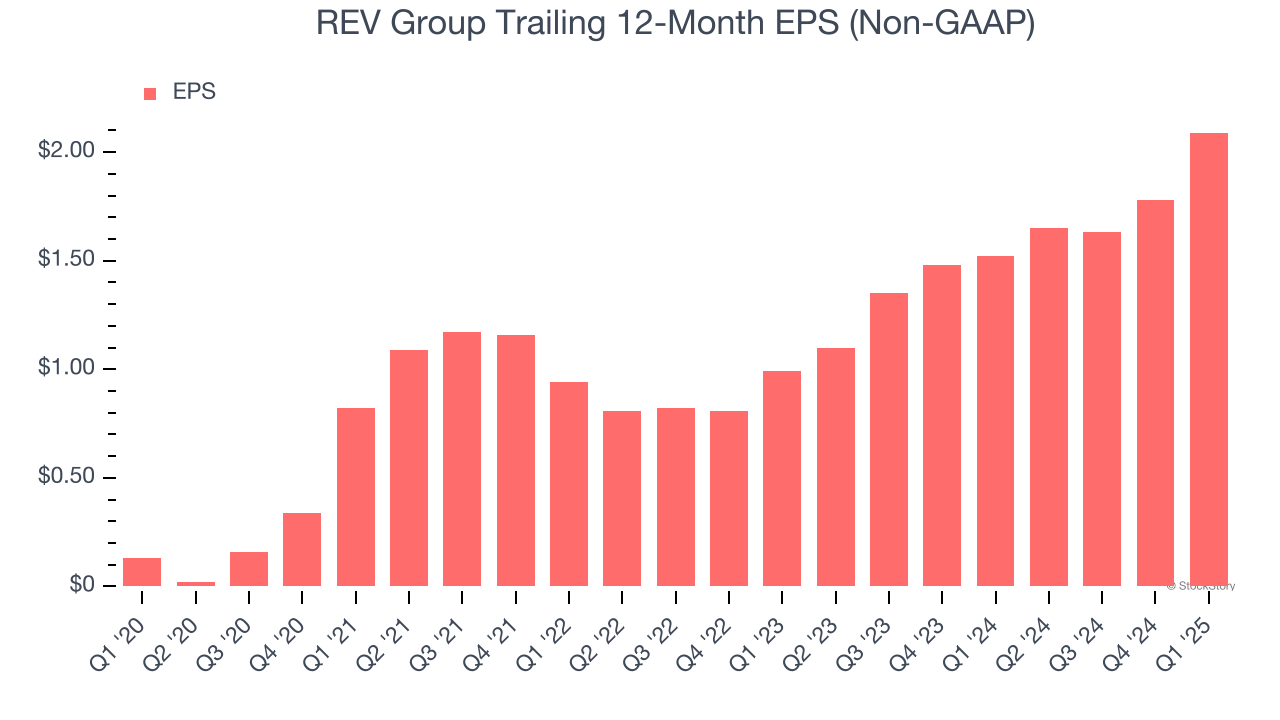
We can take a deeper look into REV Group’s earnings quality to better understand the drivers of its performance. As we mentioned earlier, REV Group’s operating margin expanded by 4.2 percentage points over the last five years. On top of that, its share count shrank by 19.9%. These are positive signs for shareholders because improving profitability and share buybacks turbocharge EPS growth relative to revenue growth. 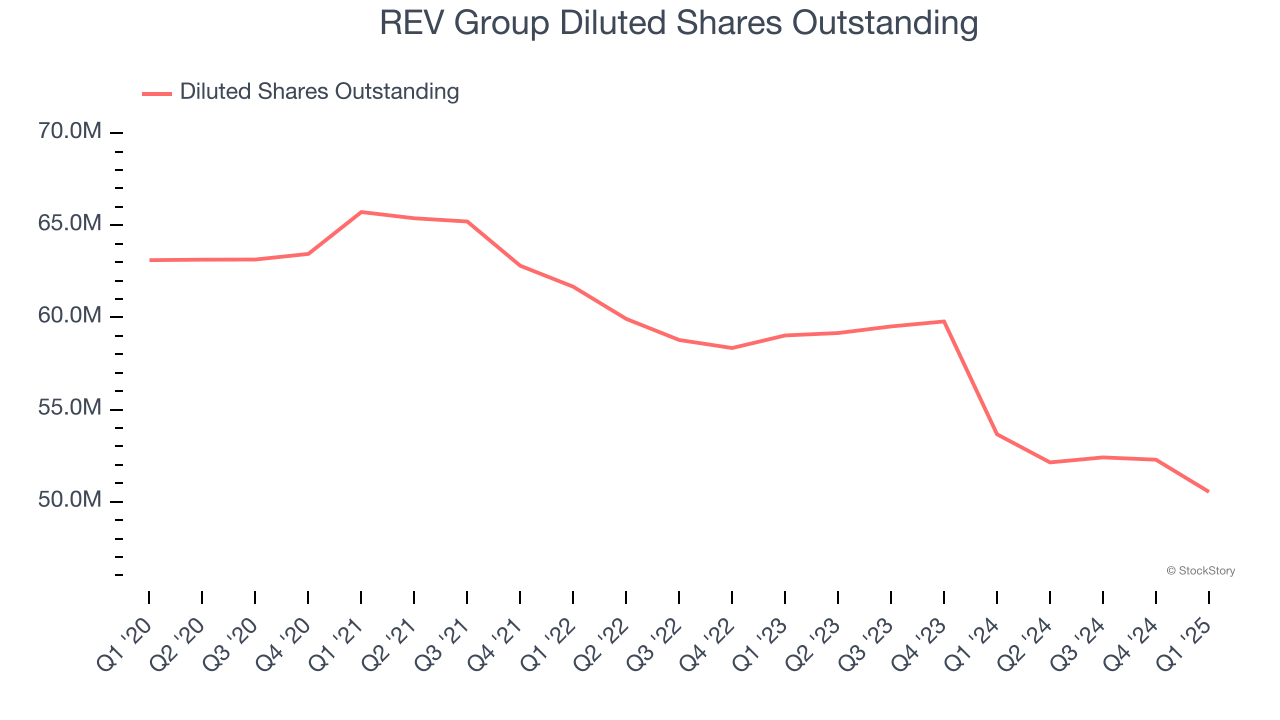
Like with revenue, we analyze EPS over a more recent period because it can provide insight into an emerging theme or development for the business.
For REV Group, its two-year annual EPS growth of 45.3% was lower than its five-year trend. We still think its growth was good and hope it can accelerate in the future.
In Q1, REV Group reported EPS at $0.70, up from $0.39 in the same quarter last year. This print easily cleared analysts’ estimates, and shareholders should be content with the results. Over the next 12 months, Wall Street expects REV Group’s full-year EPS of $2.09 to grow 33.7%.
Key Takeaways from REV Group’s Q1 Results
We were impressed by how significantly REV Group blew past analysts’ revenue, EPS, and EBITDA expectations this quarter. We were also excited its full-year EBITDA guidance outperformed Wall Street’s estimates. Zooming out, we think this was a good print with some key areas of upside. The stock traded up 3.4% to $38.50 immediately after reporting.
Indeed, REV Group had a rock-solid quarterly earnings result, but is this stock a good investment here? The latest quarter does matter, but not nearly as much as longer-term fundamentals and valuation, when deciding if the stock is a buy. We cover that in our actionable full research report which you can read here, it’s free.