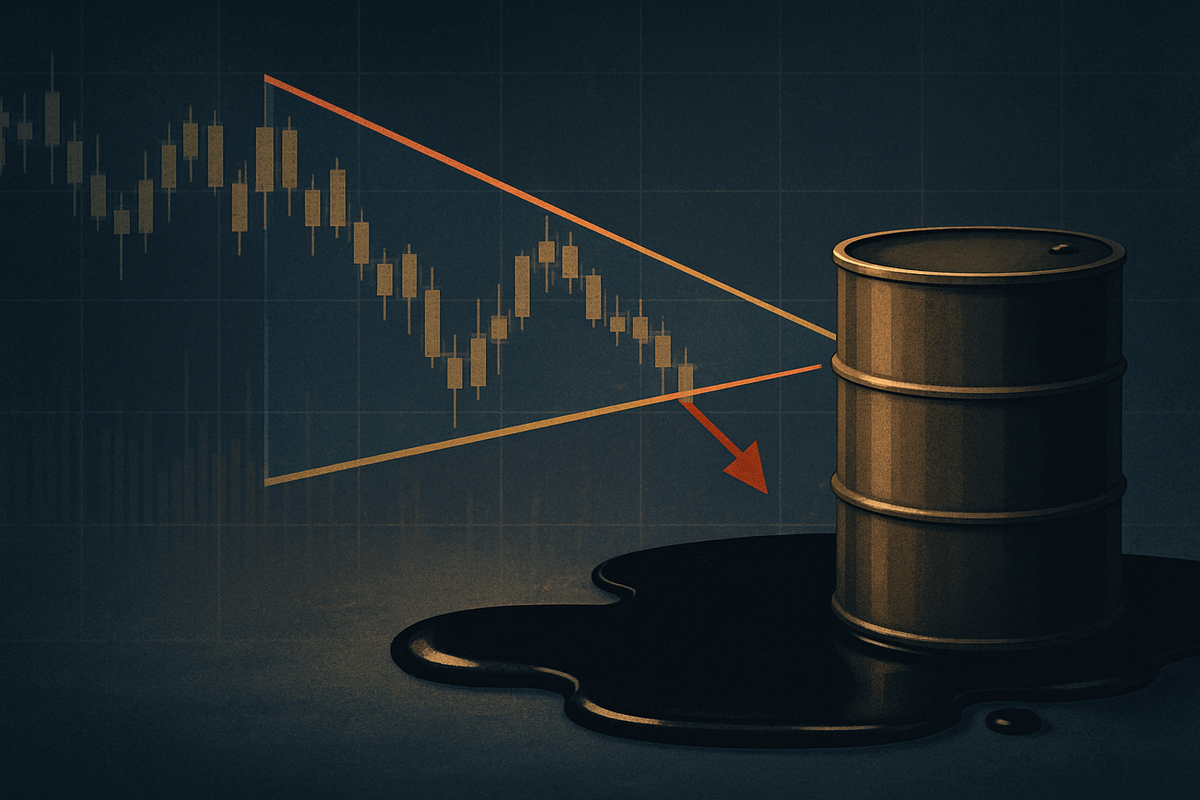
MCX crude oil is currently navigating a period of significant consolidation, exhibiting a classic bearish triangle pattern that has traders and analysts on high alert. This technical formation, characterized by a descending resistance line and a relatively flat support line, signals a tightening price range and often precedes a substantial price movement. With prices hovering around Rs 5,669 per barrel, the market is poised for a decisive breakout, the direction of which will have profound implications for energy markets and the broader economy.
The immediate future of crude oil prices hangs in the balance, as the market weighs a complex interplay of geopolitical tensions, OPEC+ supply dynamics, and evolving global demand outlooks. While short-term volatility remains subdued within the confines of the triangle, the impending resolution of this pattern could trigger either a renewed downtrend, pushing prices lower, or a surprising bullish reversal, offering a glimmer of hope to commodity bulls. Investors are closely monitoring key technical levels and fundamental catalysts, understanding that the next move could redefine trading strategies and investment theses across the energy sector.
Technical Crossroads: Unpacking MCX Crude's Bearish Triangle
The current consolidation in MCX crude oil is firmly entrenched within a bearish triangle pattern, a critical technical development that has been shaping price action for several weeks. This pattern is formed by a clear descending trendline acting as resistance, originating from the highs observed in July, indicating consistent selling pressure at higher levels. Concurrently, a relatively stable support base has emerged around the Rs 5,429–5,377 or Rs 5,429–5,579 range, demonstrating a floor where buyers have historically stepped in. The immediate resistance level for traders to watch is positioned at Rs 5,729.
Technical indicators further underscore this period of indecision. Bollinger Bands show a moderate contraction, a common characteristic of markets in a low-volatility consolidation phase, but also a precursor to an impending expansion and a significant price move. The Moving Average Convergence Divergence (MACD) histogram reflects a mixed sentiment, with neither bullish nor bearish momentum dominating, reinforcing the absence of a strong directional bias within the triangle. This technical stalemate suggests that while the market is taking a breather, underlying pressures are building, setting the stage for an explosive move once either the resistance or support is decisively breached.
The timeline leading to this pattern began with crude oil prices attempting to rally in late spring and early summer, driven by optimism around global economic recovery and supply constraints. However, these gains were met with renewed concerns over demand, particularly from major consuming nations, and an increase in supply from various producers. This led to the formation of the descending resistance line from the July highs, as subsequent rallies failed to sustain momentum. Key players in this scenario include large institutional traders, commodity funds, and individual speculators who are positioning themselves for the anticipated breakout. Initial market reactions have been cautious, with many participants adopting a wait-and-see approach, leading to reduced trading volumes and tighter spreads within the triangle's boundaries.
Potential Winners and Losers in the Crude Oil Tug-of-War
The impending breakout from MCX crude oil's bearish triangle pattern will undoubtedly create a ripple effect across the energy sector, distinguishing potential winners from losers among public companies. The direction of this breakout—whether a renewed downtrend or a bullish reversal—will dictate the fortunes of various stakeholders, from upstream producers to downstream refiners and marketers.
Should MCX crude oil break down below its critical support levels, signaling a renewed downtrend, exploration and production (E&P) companies would likely face significant headwinds. Companies like Oil and Natural Gas Corporation (NSE: ONGC) and Reliance Industries (NSE: RELIANCE), which have substantial upstream operations, would see their revenue and profitability squeezed as crude oil prices decline. Lower oil prices reduce the value of their reserves and the margins on newly extracted oil, potentially leading to reduced capital expenditure in future exploration projects and impacting their stock performance. Conversely, a sustained downtrend in crude oil prices could benefit downstream companies such as Indian Oil Corporation (NSE: IOC), Bharat Petroleum Corporation Limited (NSE: BPCL), and Hindustan Petroleum Corporation Limited (NSE: HPCL). These companies, primarily involved in refining and marketing, would benefit from lower input costs (crude oil) while potentially maintaining stable retail fuel prices, thereby expanding their refining margins and improving their profitability.
Conversely, a bullish reversal, triggered by a breakout above the descending resistance line, would provide a significant boost to upstream E&P companies. Higher crude oil prices directly translate to increased revenue and improved profitability for companies like ONGC (NSE: ONGC) and the E&P segments of conglomerates like Reliance Industries (NSE: RELIANCE). This scenario could incentivize increased investment in exploration and production activities, potentially leading to higher valuations for these companies. However, for downstream players such as IOC (NSE: IOC), BPCL (NSE: BPCL), and HPCL (NSE: HPCL), a sharp increase in crude oil prices could compress their refining margins if they are unable to pass on the full cost increase to consumers due to competitive pressures or government regulations. Midstream companies, involved in transportation and storage, might see mixed effects, with increased activity potentially boosting pipeline volumes but also facing pressure if overall demand wanes due to higher prices. The key for all these players will be their ability to adapt to the volatility and manage their hedging strategies effectively in anticipation of the breakout.
Wider Implications: A Barometer for Global Energy Trends
The consolidation of MCX crude oil within a bearish triangle pattern is more than just a technical charting event; it serves as a critical barometer for broader industry trends and carries significant wider implications for the global energy market. This pattern reflects the ongoing tug-of-war between supply-side pressures and demand-side uncertainties, a narrative that has dominated the energy sector for the better part of the year. The resolution of this pattern will not only impact crude oil prices but also send ripple effects across various energy commodities, influencing natural gas, refined products, and even renewable energy investments.
This event fits squarely into the broader industry trend of heightened volatility and uncertainty in commodity markets. Geopolitical tensions, particularly the ongoing conflict in Ukraine and potential EU sanctions on Russia, have provided intermittent support to crude prices, creating a floor for demand. However, these factors are consistently being offset by an by an increase in OPEC+ supply, particularly from nations like Saudi Arabia and the UAE, coupled with persistent high exports from Russia despite Western sanctions. Furthermore, concerns over softening global demand, particularly from China due to its economic slowdown and from other major economies grappling with inflation and potential recessions, are creating a significant supply glut. This oversupply scenario is a key factor that continues to cap any substantial gains, pushing prices into the current consolidation phase.
The potential ripple effects on competitors and partners are substantial. If crude prices break down, it could pressure smaller, less financially robust E&P companies globally, potentially leading to industry consolidation. Conversely, a bullish breakout could reignite investment in upstream projects, benefiting oilfield service providers and technology companies. Regulatory and policy implications are also at play; governments might face renewed pressure to intervene in fuel markets if prices become too volatile, either through subsidies or taxes, impacting the profitability of marketing companies. Historically, similar bearish triangle patterns in crude oil have often led to significant downside movements, especially when global demand signals are weak. For instance, periods of economic slowdowns in the past have seen crude oil breaking out of such patterns to the downside, underscoring the potential for a similar outcome if global economic concerns intensify. The key difference this time is the persistent geopolitical risk premium, which provides some underlying support, preventing a steeper decline in the absence of a definitive demand shock.
What Comes Next: Navigating the Crossroads
The resolution of the bearish triangle pattern in MCX crude oil represents a pivotal moment, with both short-term and long-term possibilities that will shape market dynamics. In the short term, traders will be keenly watching for a decisive breach of either the Rs 5,729 resistance level or the Rs 5,429 support level. A breakout above resistance could trigger a short-covering rally, potentially pushing prices towards the next major technical resistance. Conversely, a breakdown below support would likely accelerate selling pressure, with potential targets significantly lower, possibly revisiting the Rs 5,000 psychological mark or even lower, depending on the momentum.
Long-term possibilities are more complex and depend heavily on the underlying fundamental drivers that will either reinforce or contradict the technical breakout. If the breakout is to the upside, fueled by stronger-than-expected global demand recovery or significant supply disruptions (e.g., escalating geopolitical conflicts, unexpected OPEC+ production cuts), crude oil could enter a new bullish cycle. This would necessitate strategic pivots for energy companies, potentially increasing capital allocation towards exploration and production, and for consumers, who would face higher energy costs. Market opportunities would emerge in long positions on crude oil futures and equities of E&P companies, while challenges would include managing inflationary pressures for economies.
Conversely, a sustained breakdown from the triangle, driven by persistent oversupply and a weakening global economic outlook, could usher in a prolonged period of lower crude oil prices. This scenario would force energy companies to prioritize cost efficiencies, rationalize production, and potentially accelerate diversification into renewable energy sources. Market opportunities might arise in shorting crude oil or investing in companies that benefit from lower energy input costs (e.g., airlines, manufacturers). Potential scenarios range from a "soft landing" where prices gradually decline but stabilize, to a "hard landing" with a sharp and sustained drop if a global recession materializes. Investors must prepare for increased volatility and be agile in adapting their portfolios to the direction of the breakout and the evolving fundamental landscape.
Comprehensive Wrap-up: The Road Ahead for Crude Oil
The consolidation of MCX crude oil within a bearish triangle pattern marks a critical juncture for the energy market, encapsulating the complex interplay of technical signals and fundamental forces. The key takeaway is that the market is in a state of equilibrium, but this balance is precarious, with a significant directional move on the horizon. The identified resistance at Rs 5,729 and support at Rs 5,429 are not just technical levels; they represent the battle lines between bullish aspirations and bearish realities. While geopolitical tensions offer some underlying support, the persistent concerns over a supply glut and softening global demand continue to exert downward pressure, creating a highly uncertain environment.
Moving forward, the crude oil market is likely to remain highly sensitive to macro-economic data, particularly inflation reports and central bank decisions, which will influence demand projections. Decisions from OPEC+ regarding production quotas will also be paramount, as any unexpected shifts could easily trigger a breakout. The lasting impact of this period of consolidation will depend on the magnitude and sustainability of the eventual breakout. A strong bullish move could re-energize the entire energy sector, while a decisive bearish breakdown could usher in a period of lower energy costs for consumers but significant challenges for producers.
Investors should watch for several key indicators in the coming months. Firstly, monitor global economic growth forecasts, especially from major crude oil consumers like China and India, for signs of demand recovery or further contraction. Secondly, keep a close eye on OPEC+ meetings and statements regarding production policies. Thirdly, track the US dollar's strength, as a stronger dollar typically makes dollar-denominated crude oil more expensive for international buyers, potentially dampening demand. Finally, pay attention to inventory data from major hubs, as rising stockpiles would reinforce the oversupply narrative. This period of consolidation is a testament to the dynamic nature of commodity markets, demanding vigilance and adaptability from all participants.
This content is intended for informational purposes only and is not financial advice