Today seems like a good day to ask why. As in...
Why are the seemingly impervious Magnificent 7 struggling so much?
Why are small caps leading the charge?
Why is the market environment so darn confusing???
We will answer all that and more in today’s Reitmeister Total Return commentary.
Market Commentary
Let’s start with the big picture.
That being we are in the midst of long term bull market that started October 2022. And given that the average bull market lasts a little over 5 years...then likely we have a lot more time and upside still to come.
On the other hand, the early stages of a bull market offer the most impressive gains as stocks bounce from oversold conditions. That explains the +62% peak to valley tally for the S&P 500 (SPY) in less than two years. And explains why investors are keen to take some of those profits off the table from time to time.
Now is as good a time as any for that to happen even as certainty over Fed rate cuts grow. We will learn more about their intentions at the Wednesday July 31st meeting and press conference. I suspect that Powell will not say outright that cuts are coming in September...but language will be more accepting of that high probability.
As for the profits getting taken off the table, it was the Magnificent 7 that has pretty well led the charge the past year...nay 2 years...nay 10 years.
It is true that they still have attractive growth prospects as AI is the new frontier for technology. But these shares have been priced for perfection which usually leads to profit taking and normalization at some stage. Again, now is as good a time as any for that to happen.
This tackles the first question above about why the Magnificent 7 is struggling so much. And also makes for a good segue to the 2nd question: Why are small caps leading the charge?
The simple and accurate answer is that small caps have lagged all year up to this point. Correction...for the past 2 years...correction, the past 4 years.
Yet as we look back over the long history of the stock market we find that typically small cap stocks outperform by about 20% over their large cap peers (meaning the difference between 8% annual gain and just shy of 10% for small caps...not 8% vs. 28%).
Thus, it is only right for small caps to finally have some time in the sun which explains this 1 month market cap focused performance chart:
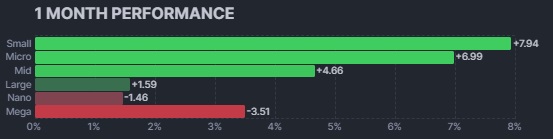
Given 4 years of underperformance for small caps it is not out of the question to expect this recent strength and market leadership to continue. Yet if there are any dark clouds that form over the market, then more Risk Off action will take place. That typically points to greater weakness for smaller companies.
One such dark cloud is that the outcome of the Presidential election in November has become less certain. That historically has led to an overall market pullback starting in August/September. But once the election becomes finalized a big rally ensued (that is because uncertainty over the election has given way to certainty).
The above explains why I have added a dose of caution to our portfolio mix given this downside potential. (More specifics in the Portfolio Update section below).
I am not calling for anything ominous. Perhaps a test of some key support levels for the market to shake off the complacency that comes from ample stock market gains in the recent past:
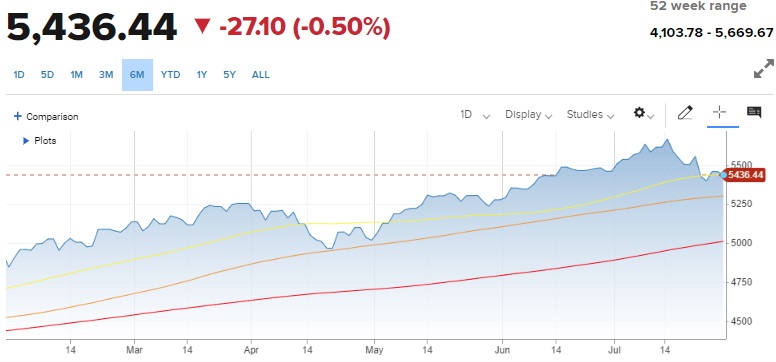
Moving Averages: 50 Day (yellow) @ 5,442 > 100 Day (orange) @ 5,298 > 200 Day (red) @ 4,991
Today we once again tested the 50 day moving average. Yet the stock market often cuts through that trend line many times throughout the year.
More interesting is the 100 day moving average (currently @ 5,298) which has been pretty firm support for a while. A test of that level seems likely in the weeks ahead. The more curious question is whether the 200 day moving average will come under attack.
That would represent a more sizeable 12% correction for the overall market. That seems outrageous on the surface...but often a healthy pause for stock advances before the next leg higher. Meaning this is a period where excesses are peeled back and valuations get rightsized.
The above also tells you that value will likely be more at the center of the investment equation going forward. Gladly the POWR Ratings has a value bias which has served us well in the past...and likely to serve us well if indeed a rough patch is on the way.
Betting fully on downside in the midst of a bull market is by no means a slam dunk. That is why I have only made modest moves to take advantage of this potential correction in the portfolio as the rest of our positions are more traditional Risk On bullish picks that benefit from more market upside.
My true hope is that the bull market continues to rage on for which the majority of our positions would benefit. Yet, given history and the facts in hand (like the election cycle) I believe a dose of caution is wise at this juncture.
More on my specific stock and ETF picks in the section ahead...
What To Do Next?
Discover my current portfolio of 11 stocks packed to the brim with the outperforming benefits found in our exclusive POWR Ratings model. (Nearly 4X better than the S&P 500 going back to 1999).
On top of that we have created a hedge against looming downside with 2 unique ETFs.
All of these hand selected picks are all based on my 44 years of investing experience seeing bull markets...bear markets...and everything between.
And right now this portfolio is beating the stuffing out of the market.
If you are curious to learn more, and want to see all these timely 13 trades, then please click the link below to get started now.
Steve Reitmeister’s Trading Plan & Top 13 Picks >
Wishing you a world of investment success!

Steve Reitmeister…but everyone calls me Reity (pronounced “Righty”)
CEO, StockNews.com and Editor, Reitmeister Total Return
SPY shares fell $1.70 (-0.31%) in after-hours trading Tuesday. Year-to-date, SPY has gained 14.75%, versus a % rise in the benchmark S&P 500 index during the same period.
About the Author: Steve Reitmeister

Steve is better known to the StockNews audience as “Reity”. Not only is he the CEO of the firm, but he also shares his 40 years of investment experience in the Reitmeister Total Return portfolio. Learn more about Reity’s background, along with links to his most recent articles and stock picks.
The post Why Are Stocks So Unsettled? appeared first on StockNews.com