-
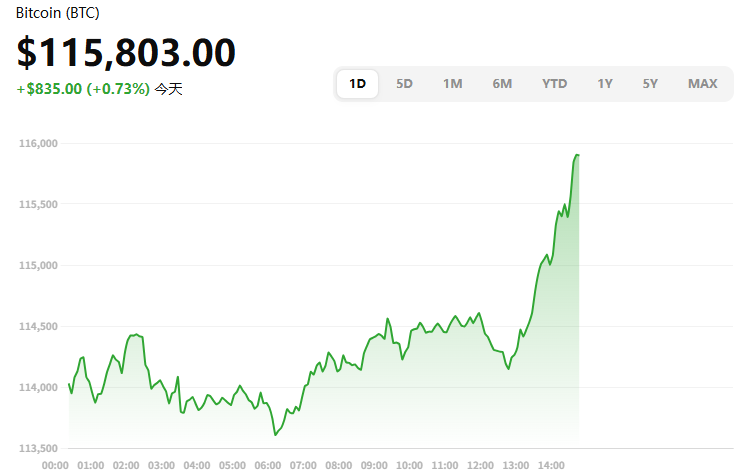
Current Range: BTC is around $115.8K; daily range is $113.6K-$116.0K, showing a short-term narrowing of the consolidation.
-
Sentiment: Fear & Greed Index = 37 ("Fear") with a very cautious risk appetite.
-
Derivatives: Both global and CME Open Interest (OI) are still quite high — thus the coexistence of hedging and speculative positions makes the prices very sensitive to macro and liquidity events.
-
Flows: The daily inflows and outflows of the U.S. spot BTC ETF are turning to each other; one should see this in the context of intraday volatility and U.S. Treasury yields. Farside Investors panel is highly recommended for real-time monitoring.
-
Price: BTC is very close to $115.8K at the moment; during the day, the highest was $116.0K, and the lowest was $113.6K. The volatility is getting smaller, and the volume is more or less even.
-
Sentiment: Fear & Greed = 37, which is better than last week with "Extreme Fear/Fear" but still below the neutral line — investors are still hesitant to a sustained upside momentum.
Derivatives Structure (Derivatives)
-
Global OI: Total Open Interest across the trading platforms (Binance / OKX / Bybit / CME, etc.) is still very close to the top indicating a significant number of leveraged positions. In a scenario where the price goes down below the key intraday/weekly levels, the forced-liquidation cascades could become the reason for tail risks getting bigger.
-
CME Bitcoin Futures: Institutional OI and trading volumes are the main sources of life for the market. The hedging and spread strategies of the traditional funds, on the one hand, are the factors that increase volatility, on the other, they serve as both amplifiers and stabilizers of the spot price movements.
Strategic Implications:
-
Elevated OI + poor sentiment → greater chances of “minor news causing major volume changes.” The focus of the day should be more on event-driven or range-bound trades rather than momentum trading.
-
A notable reduction in OI together with a further drop in the Fear Index is quite often instrumental in signaling a deleveraging process, thus implying potential for oversold rebounds.
Capital Flows & Spot ETFs (Spot ETFs)
-
The daily net flows are changing from inflows to outflows and vice versa, and their correlation with Treasury yields, DXY, and macro guidance (especially Fed communications) is getting stronger and stronger.
-
The historical data affirm that substantial single-day outflows do not necessarily mean the end of a trend, but rather they raise the chances of a short-term pullback and decrease the risk budgets (which can be seen in several episodes that happened this year).
Key Price Levels & Market Setups (Levels & Setups)
-
Upper Range: $116K–$118K (intraday box top and recent high-volume zone). The follow-through to the $120K psychological level should be considered if the breakout is accompanied by a strong volume.
-
Lower Range: $113K–$114K (intraday low band + last week’s mean area). The collapse can cause the triggering of programmatic selling as well as passive deleveraging, thereby resulting in volatility expansion.
Forward Event Watchlist (What Could Move the Tape)
-
U.S. Macro Data / Treasury Yields: The rising of the yields usually discourages the risk appetite, thus the ETF outflows can be the reason of the futures deleveraging in the same rhythm.
-
Large ETF Daily Flow: (≥ $300M) one-way net flow is often followed by directional price moves within 24–72 hours (Farside’s real-time updates are good for tracking).
-
CME Delivery & Options Expiry: Around expiry, the rebalancing of Gamma/Delta may give rise to the so-called “no-news volatility” phenomenon.
Action Recommendations (Not Financial Advice)
-
Intraday: Act reversals at edges of the $113K–$116K range and only work with breakouts if there is an increase in volume.
-
Risk Management: Keep an eye on simultaneous OI alterations and slight changes in the Fear & Greed Index (<30 → potential rebound elasticity; >55 → overheating risks).
-
Mining/Hashrate Participants: To offset production fluctuations, do CME futures hedging, and assess the cost of cloud hashrate, electricity rates, and ROI cycles to maximize your cash flow.
-
Real-time price and intraday range: web.finance data feed.
-
Fear & Greed Index: Alternative.me live dashboard.
-
Global/Exchange OI & funding data: CoinGlass derivatives panel (see methodology page).
-
CME Bitcoin futures OI & volume: CME Group official data.
-
U.S. Spot BTC ETF daily flows: Farside Investors (auto-updated intraday).
Small institutions and individuals controlling digital asset portfolios can take part in the process through compliant renewable-energy data centers, which provide a light-asset way of sharing block rewards and transaction fees — thus minimizing hardware and maintenance costs. Nevertheless, there is still a need for hedging against price cycle risk and cost locking.
See FLAMGP's standardized agreements and operational frameworks for more details (being transparent with things like disclosures and fee structures is the key).
Visit https://flamgp.com for additional information.
Disclaimer:
This article is for informational purposes only and does not constitute financial advice. Cryptocurrency investments carry risk, including total loss of capital. Readers should conduct independent research and consult licensed advisors before making any financial decisions.
Crypto Press Release Distribution by BTCPressWire.com
Copyright (c) 2025 TheNewswire - All rights reserved.