top of page


(TSV:CAI)
Price and Volume
Detailed Quote| Volume | 1,000 |
| Open | 0.0150 |
| Bid (Size) | 0.0100 (24,410) |
| Ask (Size) | 0.0150 (690) |
| Prev. Close | 0.0100 |
| Today's Range | 0.0150 - 0.0150 |
| 52wk Range | 0.0100 - 0.0250 |
| Shares Outstanding | N/A |
| Dividend Yield | N/A |
Top News
More News
Performance
52-Week Range
40.0% below 52-week high
0.0150
0.0152W Low
0.0352W High
(CAI) traded between $0.01 and $0.03 over the past 52 weeks and last traded at $0.01, 40.0% below its 52-week high.
Past 12 Months
1W
+$0.00
1M
-$0.01
3M
6M
YTD
1Y
CAI was +50.0% in the last week.
12 Months vs Market
CAI
N/A
DIA
+8.4%
SPY
+10.4%
QQQ
+9.5%
IWM
+13.9%
Over the past 12 months CAI returned N/A versus DIA (Dow) +8.4%, SPY (S&P 500) +10.4%, QQQ (Nasdaq 100) +9.5% and IWM (Russell 2000) +13.9%.
Volume & Liquidity
0.05× 3-mo avg
Today 1,000
3-mo avg 18.5K
1W
83.3K
1M
27.8K
3M
18.5K
6M
31.1K
YTD
22.2K
1Y
18.9K
CAI most recently traded 1,000 shares against a 3-month average daily volume of 18.5K.
More News
Read More
Northern California Women Artist Exhibition at John Natsoulas Gallery
February 28, 2023

Wickedly Awesome Welcomes Rumored Release of Canon R5 Mark II
February 25, 2023
EveryDay Office Supplies To Help Offices in Canada
February 23, 2023


Angio Suites Market Is Poised to Reach at High CAGR of 5% by 2022-2029
February 07, 2023
Everyday Office Supplies Provides Wholesale Office Supplies in Canada
February 01, 2023

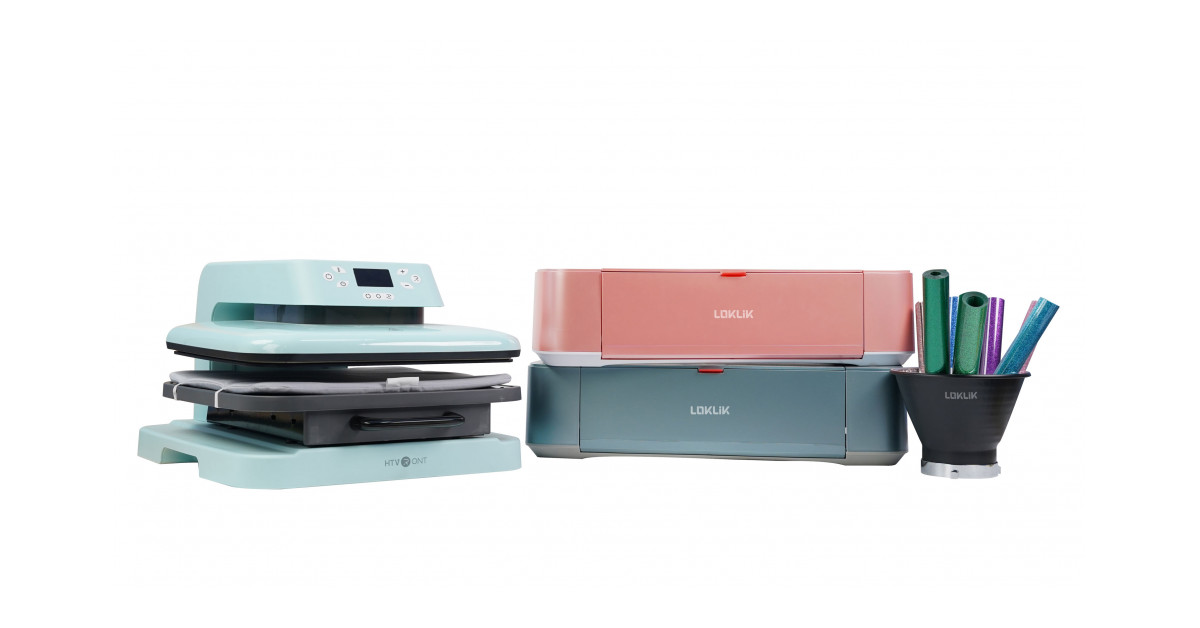
LOKLIK and HTVRONT Are Going to Make Their First Appearance at CES
January 03, 2023




Frequently Asked Questions
Is CAI publicly traded?
Yes, CAI is publicly traded.
What exchange does CAI trade on?
CAI trades on the Toronto Venture Stock Exchange
What is the ticker symbol for CAI?
The ticker symbol for CAI is CAI on the Toronto Venture Stock Exchange
What is the current price of CAI?
The current price of CAI is 0.0150
When was CAI last traded?
The last trade of CAI was at 11/13/26 10:03 AM ET
Stock Quote API & Stock News API supplied by www.cloudquote.io
Quotes delayed at least 20 minutes.
By accessing this page, you agree to the Privacy Policy and Terms Of Service.
Quotes delayed at least 20 minutes.
By accessing this page, you agree to the Privacy Policy and Terms Of Service.
© 2025 FinancialContent. All rights reserved.
bottom of page