 Photo by Markus Spiske on Unsplash
Building a retirement portfolio means picking stocks you’re comfortable holding for decades, not quarters. That demands deep research on company fundamentals, financial health, and competitive durability. The problem? That kind of research takes hours per name if you do it by hand.
The best fundamental stock analysis software compresses that workflow dramatically while helping you make smarter, more calculated decisions. The challenge is cutting through the dozens of options to find the one that actually fits your retirement-focused approach.
This guide compares five of the top platforms with a long-horizon lens so you can lock in the right tool and get back to compounding.
Ranking the 5 Best Fundamental Stock Analysis Software
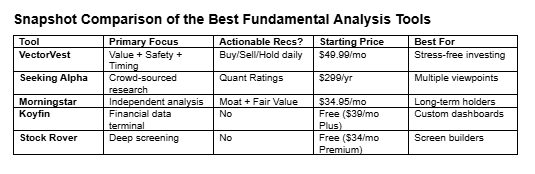
All five platforms below hold up well, though each works a little differently and suits a different kind of investor. We ranked them on usability and the quality of insight they produce, starting with VectorVest’s stock analysis software.
1. VectorVest
This proprietary stock rating system from VectorVest has outperformed the S&P 500 index by 10x over the past 20+ years. It tells you what to buy, when to buy it, and when to sell it. No guesswork, emotion, or hours glued to a screen. The simplest way to win more trades with less work, retirement-focused or otherwise.
Every stock receives an overall VST rating composed of three sub-ratings:
- Relative value (RV): Compares a stock’s long-term price appreciation potential (forecasted three years out), AAA corporate bond rates, and risk. A much better indicator than price-to-value alone.
- Relative safety (RS): Assesses the company’s financial consistency and predictability, debt-to-equity ratio, business longevity, sales volume, and other risk factors.
- Relative timing (RT): Based on the direction, dynamics, and magnitude of a stock’s price movement. It’s calculated day over day, week over week, quarter over quarter, and year over year.
Each rating sits on a simple 0.00 to 2.00 scale, where 1.00 is average. The combined score drives a buy, sell, or hold recommendation. Advanced tiers add real-time data powered by the Nasdaq last sale feed.
There’s also an overall market timing indicator telling you when to lean in and when to park in cash. VectorVest has called every major market move over the past 20 years.
Daily stock picks keep ideas flowing, so you never have to search for your next trade. Market Launchpad starts at $49.99/month and covers 9,500+ stocks. The full desktop experience begins at $149/month.
Pros
- Clear Buy, Sell, or Hold recommendation on every stock, every day
- Proprietary VST system backed by 30+ years of development
- Market timing signals with a documented historical track record
- Plans for beginners through active traders
- US-based phone support on all tiers
Cons
- Desktop software required for Enhanced and Premium tiers
- No free plan (30-day trial at $9.95)
Best For
Investors looking to take all the human error, emotion, and guesswork out of investing and win more trades with less work.
2. Seeking Alpha
Seeking Alpha stands out as the best fundamental stock analysis software when you want commentary from a wide variety of individuals. Thousands of contributors publish long-form stock analysis in one place, and you can read across them to form your own perspective.
The platform also runs its own Quant Ratings system, scoring every stock across Value, Growth, Profitability, Momentum, and EPS Revisions. The structural concept resembles VectorVest’s VST system (another proprietary stock rating system).
The price gap is the real draw. Seeking Alpha costs just $299/year for premium. No monthly billing option exists, though at that annual rate, taking a chance isn’t much of a risk.
Pros
- Massive library of analyst opinions and long-form research
- Quant Ratings scored daily across five fundamental factors
- You get access to earnings call transcripts
Cons
- Annual billing only
- No direct Buy/Sell/Hold action signal
- Information overload from 10,000+ articles per month
- The quality of information in contributor pieces can be hit or miss
Best For
Self-directed investors who want multiple perspectives before making their own call.
3. Morningstar
Morningstar has been the industry standard in independent investment research since 1984, so it’s legitimately impressive that it still makes the cut on 2026 rankings of the best fundamental stock analysis software.
Over 120 global analysts cover 1,000 individual stocks and 1,600 mutual funds and ETFs. They publish reports with fair value estimates built on a proprietary discounted cash flow model. Every covered stock also gets an Economic Moat Rating:
- Wide (competitive advantage expected to last 20+ years)
- Narrow (10+ years)
- None
Moats are evaluated across five sources: cost advantage, intangible assets, network effect, switching costs, and efficient scale.
There’s also the Star Rating system (1 to 5) that assesses risk-adjusted historical performance. The newer Medalist Ratings are forward-looking, grading funds on process, people, parent company, performance, and price.
Portfolio X-Ray is another standout feature. It breaks down your combined holdings and surfaces overlaps you might not have realized existed, plus fee drag and sector concentration. Pricing starts at $34.95/month or $249/year, with a 7-day free trial for both.
Pros
- 40+ years of independent, conflict-free research credibility
- Economic Moat Rating on covered stocks with five structural factors
- Fair value estimates powered by analyst-driven DCF models
- Portfolio X-Ray exposes hidden overlaps and fee drag across holdings
Cons
- Only about 1,000 stocks get full analyst coverage
- Dense interface with a steep learning curve
- Even paid plans get served ads
- Free brokerage platforms (Schwab, Fidelity) already include some Morningstar data
Best For
Buy-and-hold investors who care about independent analyst research.
4. Koyfin
Koyfin is interesting on multiple fronts. Built like a financial terminal but priced for retail investors. The browser-based platform lets you build custom dashboards combining charts, watchlists, financial data tables, and news feeds in one workspace.
You can graph a company’s P/E ratio across a decade while overlaying revenue growth on the same chart, then benchmark the result against an index or competitor. Extremely detailed fundamental analysis. Empowering for some users, overwhelming for others.
Another selling point: Koyfin spans beyond equities, so you could consider it the best fundamental stock analysis software if your retirement allocation includes ETFs, global stocks, bonds, forex, and futures.
A free tier handles basic screening, though it’s limited. The Plus plan ($39/month on annual billing) unlocks 10 years of company financial history, analyst estimate data, earnings transcripts, SEC filings, and up to 10 custom formulas. Premium ($79/month) removes formula limits and adds portfolio risk metrics, hypothetical performance modeling, and alerts.
Pros
- Unparalleled charting capabilities with fully customizable multi-panel dashboards
- Global coverage spanning equities, bonds, forex, futures, and macro data
- 10 years of financial history on Plus, with analyst estimates and transcripts
- Free tier for basic research
Cons
- No actionable recommendations (just raw data)
- Can’t download/export financial statements
- No backtesting capabilities
- Browser-only, no mobile app
Best For
Investors who want as much data as they can get their hands on at consumer pricing. You will have to be comfortable building your own analytical workflow.
5. Stock Rover
Stock Rover brings serious screening depth. The platform features 800+ filtering criteria (on the Ultimate plan) across stocks, ETFs, and mutual funds. Pre-built screeners like Bargain Hunter and the Buffetology Screener are included for anyone who doesn’t want to build their own.
You can pull historical fundamental data going back up to 20 years depending on the plan, letting you evaluate valuation metrics against actual outcomes across full market cycles. Particularly valuable for retirement-focused analysis.
Higher tiers unlock more sophisticated features: correlation analysis, Monte Carlo simulations for portfolio projections, and dividend forecasting (especially useful for income-focused retirement portfolios). Premium starts at $34/month; Ultimate Pro (built for advisors and professionals) is $199/month.
Pros
- Unparalleled depth with 800+ screening criteria on top-tier plans
- 10-20+ years of historical fundamental data (depending on subscription)
- Monte Carlo simulations, correlation analysis, and dividend forecasting
- Research reports and peer comparison tools on Premium Plus and above
Cons
- Significant learning curve: the sheer volume of metrics is overwhelming
- Deep screening limited to US and Canadian securities
- No mobile app (browser-only on desktop)
- Interface is powerful but a little dated visually
Best For
Investors who build custom screens, backtest valuation criteria, and want granular control over hundreds of financial metrics.
Is There a Difference Between the Tools Retail Investors and Institutions Use?
Yes, at least historically. The gap has narrowed meaningfully as retail investors gain access to the best fundamental stock analysis software powered by many of the same feeds.
Institutional investors still rely on Bloomberg Terminal, FactSet, and Capital IQ. Seats on those platforms run $20,000+ per year each. Firms pay that premium for real-time data and proprietary models that drive more calculated decisions.
Tools like VectorVest now carry real-time data feeds too. VectorVest pulls data from the Nasdaq last sale feed. For a buy-and-hold retirement investor, that may matter less than it would for a day or swing trader, but it still shapes how quickly you can react to news and price action.
Tips on Assessing the Fundamental Analysis Software
You could argue for any of these as the best fundamental analysis tools for a specific investor profile. The easiest way to narrow it down is answering a few questions:
- Do you want data or direction? Many tools hand you the raw insights and leave the next step to you. VectorVest, by contrast, tells you what to DO.
- How much time can you commit daily? Stock Rover and Koyfin are chart-heavy and demand hours. VectorVest’s Market Launchpad asks for just 10 minutes.
- What markets do you trade? Some platforms are US and Canadian equities only. Koyfin spans global markets.
- What’s your budget? Koyfin and Stock Rover offer free tiers to get started. But you get what you pay for, and options like VectorVest may deliver better value for the money.
Ultimately, only you can decide which is the best stock forecasting software for your retirement goals. But if we had to give one recommendation on the best fundamental stock analysis software, it would be VectorVest.
Frequently asked questions
What is fundamental analysis?
Fundamental analysis assesses a company’s financial health. It looks at earnings, revenue, debt, and growth rates. The purpose is figuring out whether a stock is overpriced, undervalued, or fairly priced relative to what the underlying business is actually worth.
What is the best fundamental analysis tool for retail investors?
VectorVest. It handles both fundamental and technical analysis for you, then delivers a clear buy, sell, or hold recommendation. Other tools make you interpret raw numbers yourself.
What’s the difference between fundamental stock analysis software and technical trading tools?
Fundamental stock tools evaluate a company’s value and safety. Technical tools look at timing: what the stock’s price might do next. Most investors rely on a combination. Long-term retirement investors lean on fundamentals. Short-term traders lean technical.
What is the best app for fundamental analysis of stocks?
The best stock app for iPhone or Android users alike is the VectorVest stock advisory.
How much should I plan on spending per month on the best fundamental stock analysis software?
Anywhere from $10 to $150 a month. VectorVest may be the most expensive on this list, but you get what you pay for. Genuinely the best fundamental analysis tool on the market.
Bottom Line on the Best Fundamental Stock Analysis Software
All five platforms belong on this list for good reason. But you only need one in your retirement arsenal, and that one is probably VectorVest. It simplifies complex fundamental analysis and delivers decision-ready insights. Learn more about how it works today.