
The market has been swept by a sea of red month-do-date (MTD), with the overall market, the SPDR S&P 500 ETF (NYSE: SPY) down over 3% MTD. Apart from one sector, most sectors and industries have suffered the same outcome.
While the overall market has experienced significant momentum to the downside, taking out the August lows, the energy sector managed to take out its August highs and maintain its steady uptrend. MTD, the energy sector ETF, Energy Select Sector SPDR Fund (NYSE: XLE), is up over 4%.
Over the previous month, capital has steadily flown out of various sectors, such as technology, retail, and consumer discretionary, and into the energy sector. So the question remains: will the XLE continue outperforming into year-end?
Disconnect Between the Energy Sector and Overall Market
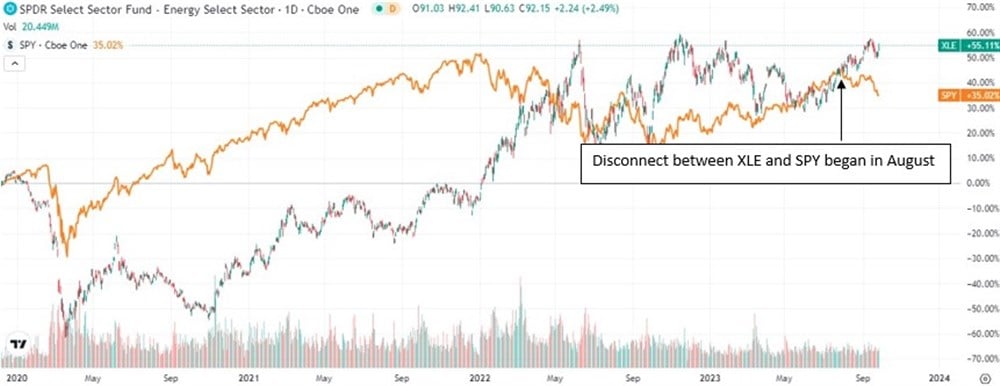
The above chart illustrates that the disconnect between the energy sector and the overall market began in August. SPY experienced outflows, while the XLE saw its share price steadily appreciate after breaking above its April high.
The immense relative strength in the energy sector is no surprise, as crude oil prices have been surging higher in recent weeks. This trend of increasing oil prices arose from concerns about tighter global inventories after output cuts from Saudi Arabia and Russia.
As a result, the XLE, which aims to mirror the price and yield performance of the Energy Select Sector Index, has soared over 4% this month and 15.35% during the quarter.
Investors looking to gain exposure to the industry can do so by investing in the XLE ETF or in the top-weighted individual names of the ETF.
Three Top Weighted Names in XLE
The ETF has almost 96% exposure to the United States and predominantly comprises oil, gas, and consumable fuels industry exposure. Its three top-weighted holdings will come as no surprise, given their dominance and market capitalization.
XOM is the top holding of the ETF with a 21.11% weighting. Exxon has been on a tear lately, up over 11% over the month and almost 15% over the previous three months. Notably, the stock recently made a new high, reaching $120.20 per share and achieving a market capitalization of $481.18 billion. Impressively, given its recent surge higher, the stock is trading with a modest 9.62 P/E ratio and has a 3.03% dividend yield.
CVX is the ETF's second-largest holding, with an 18.52% weighting. While the stock's recent gains are not as impressive as XOM, with it up almost 7% over the month and nearly 11% over the previous three months, the stock has set up favorably from a technical analysis perspective. Currently, CVX is trading in a bullish ascending wedge pattern, signaling a potential upside if the stock can break above $173. CVX boasts an impressive 3.53% dividend yield and 10.85 P/E ratio.
The ETF’s third largest holding is SLB, with a 5.38% weighting. SLB’s market cap is significantly smaller than the above two, at $86.41 billion. The stock’s dividend yield is also smaller, currently at 1.64%. However, over the previous three months, shares of SLB are up almost 27%. The stock is nearing a critical level of resistance at $62, with a move above this level potentially indicating that momentum will continue to the upside.
