The Charles Schwab Company (NYSE: SCHW) can hit new highs, not just a new weekly or monthly high but a new multi-year high with the potential for a new all-time high. The last year was challenging for the business and investors with the banking crisis, shaken investor sentiment, and tightened fiscal policy to impact results. The takeaway is that the company gained leverage while weathering the storm and is set for an accelerated recovery over the next two years.
The forecast indicates a return to growth this year and double-digit top-line growth in F2025, which Q1 results suggest is cautious. Because earnings are expected to grow at double the top-line pace, investors might expect another robust year of dividends, dividend increases, and share repurchases.
The Charles Schwab Corporation Had a Good First Quarter
The Charles Schwab Corporation reported another YOY decline in revenue and earnings, but the metrics are good. The YOY decline is shrinking, sequential growth is improving, and the margin is widening. The $4.74 billion in net revenue outpaced the consensus estimate by a slim margin but supported by all operating segments. The company reports a $96 billion increase in net new client assets, or up 20%; fee-based revenue tied to premium services is also up 20%. Total client assets topped $9.1 trillion to reach a record level as new clients and new money flocked to the platform.
The margin news is among the best details of the report. The company’s pretax profit margin improved by 500 basis points to 37.9%, 40.9% adjusted, and gains are expected to stick. Margin gains are due to client leverage and operating efficiencies that should aid improvement as the year progresses; the March data shows client in-flows accelerating. The bottom line result is $0.74 in adjusted earnings, a penny better than expected.
The balance sheet remains healthy, and the company's cash is growing. The tier 1 capital ratio is solid at 8.8%, and the cash flow is robust. Cash flow allowed for dividends and share repurchases, which reduced the diluted count by about 6% compared to last year. The dividend aligns with the broad market average but is much safer because the payout ratio is less than 35%. Schwab doesn’t make regular distribution increases but tends to increase over time. There is sufficient room in the numbers, so another increase could come this year.
Analysts Provide a Tailwind for Charles Schwab Stock
Analysts cut their ratings and trimmed their targets for SCHW stock last year, but the trend changed in 2024, and there is a tailwind in place. The revisions leading to the report's release include numerous upgrades and price target increases. They have sentiment firming to near Moderate Buy, and the stock trades above the broader consensus. The consensus assumes the market is fairly valued at current levels, but the fresh targets suggest that up to 20% upside is ahead. If the analysts continue to revise sentiment and price targets positively, the market should have no trouble moving to the $80 to $85 region. Institutions also support this market. Their activity has been net-positive for the market in the last two quarters, aligning with the updraft in price action.
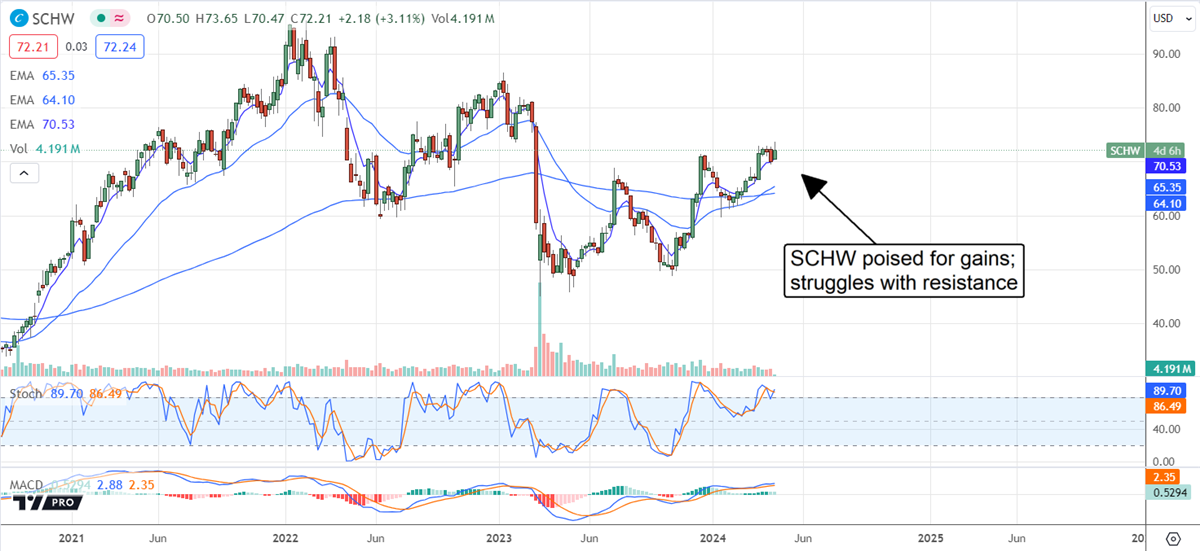
The Charles Schwab Company stock surged 5% following the release and may move to a new high soon. However, resistance is present at current levels and my cap gains. The critical line is near $72.50; a move above could lead this market to the $80 level. Assuming the company continues to build leverage and deliver the expected results, analysts should continue lifting the market, possibly leading it to a new high. The risk for SCHW investors is the Fed. The Fed will likely keep interest rates higher than the market is pricing in and may lengthen the time until full recovery.