
Myriad Genetics Inc. (NASDAQ: MYGN) is a leader in genetic testing and precision medicine. The company offers a wide variety of genetic tests including hereditary cancer tests that assess the risk for developing certain types of cancer based on genetics. The benefits of Myriad's genetic tests can't be overstated. They enable proactive health management by helping to identify potential diseases early on. They assist medical providers in making better-informed treatment plan decisions, ultimately improving patient outcomes.
Myriad Genetics operates in the medical sector, competing with various medical testing and lab companies like Quest Diagnostics Inc. (NYSE: DGX), Exact Sciences Co. (NASDAQ: EXAS) and Natera Inc. (NASDAQ: NTRA).
Myriad Genetics Offers Many Types of Molecular Tests
Its top seller is the MyRisk Hereditary cancer test, which evaluates 48 genes to help identify a patient's risk of developing 11 different types of hereditary cancer. Its prognostic tests can help predict the likelihood of disease progression and aggressiveness. Carrier screening tests enable couples who want to start a family to identify potential genetic conditions that may be passed on to their children. Prenatal screening tests detect early chromosomal abnormalities in fetuses.
Myriad's Non-Invasive and Patient-Centric Tests
Early detection is always the key. Myriad's tests are mostly non-invasive, making them more patient-centric. For example, biopsies can be painful but necessary procedures to remove a small amount of tissue to be tested in a laboratory to diagnose problems like cancer. In most cases, a biopsy is the only definitive method to diagnose cancer. Myriad also mentions that 97% of private insurers cover hereditary cancer testing.
Myriad’s IPG Acquisition Bolsters its Liquid Biopsies and Tumor Profiling Offerings
Myriad’s acquisition of Intermountain Precision Genomics (IPG) bolsters its offering of tumor profiling and liquid biopsy tests. Its Precise Tumor Test is a somatic test that uses state-of-the-art next-generation sequencing to identify and target important variants within tumors. The panel of over 500 genes examines DNA and RNA to match patients with advanced solid tumors to appropriate therapy and clinical trials. Precise Liquid enables comprehensive genomic testing from a blood draw.
Losses Narrow for Myriad Genetics as Revenues Climb Double Digits in Q1 2024
Myriad Genetics reported a Q1 2024 EPS loss of a penny, beating consensus estimates by 9 cents. GAAP net loss for Q1 2024 was $26 million, and adjusted EBITDA was $4 million. Revenues rose 11.6% YoY to $202.2 million, beating consensus estimates for $193.51 million. Gross margin increased 70 bps YoY to 68.1%. Adjusted gross margin rose 80 bps to 68.5%.
MYGN's Hereditary Cancer and Prenatal Testing Led Revenue Growth
Hereditary cancer tests generated the lion’s share of revenue at $88.1 million, up 16% YoY. Prenatal test revenues saw a 22% YoY gain to $44.3 million. Pharmacogenomics revenues saw a 21% YoY gain to $38.9 million. Tumor profiling experienced a 17% YoY decline to $30.9 million.
Myriad Genetics CEO Paul Diaz commented, “First quarter saw early indications of market share gains in hereditary cancer and prenatal testing, and we expect this trend to accelerate as we move through the year. In addition, the first quarter average revenue per test across our product portfolio benefited from expanded coverage and our ongoing efforts in revenue cycle management."
Myriad Reaffirms Full Year 2024 Guidance
Myriad Genetics expects 2024 EPS to break even at 5 cents, compared to 3 cents in consensus analyst estimates. Full-year revenues are expected to be between $820 million and $840 million, compared to $826.22 million.
CEO Diaz concluded, “We also remain optimistic about the evolution of our product portfolio as we continue to produce additional clinical validation studies and move closer to the launch of our new products. At the same time, we continue to advance a number of enhancements to improve access and ease of use for our customers, including electronic medical record (EMR) integrations, and make meaningful progress in our Labs of the Future initiative.”
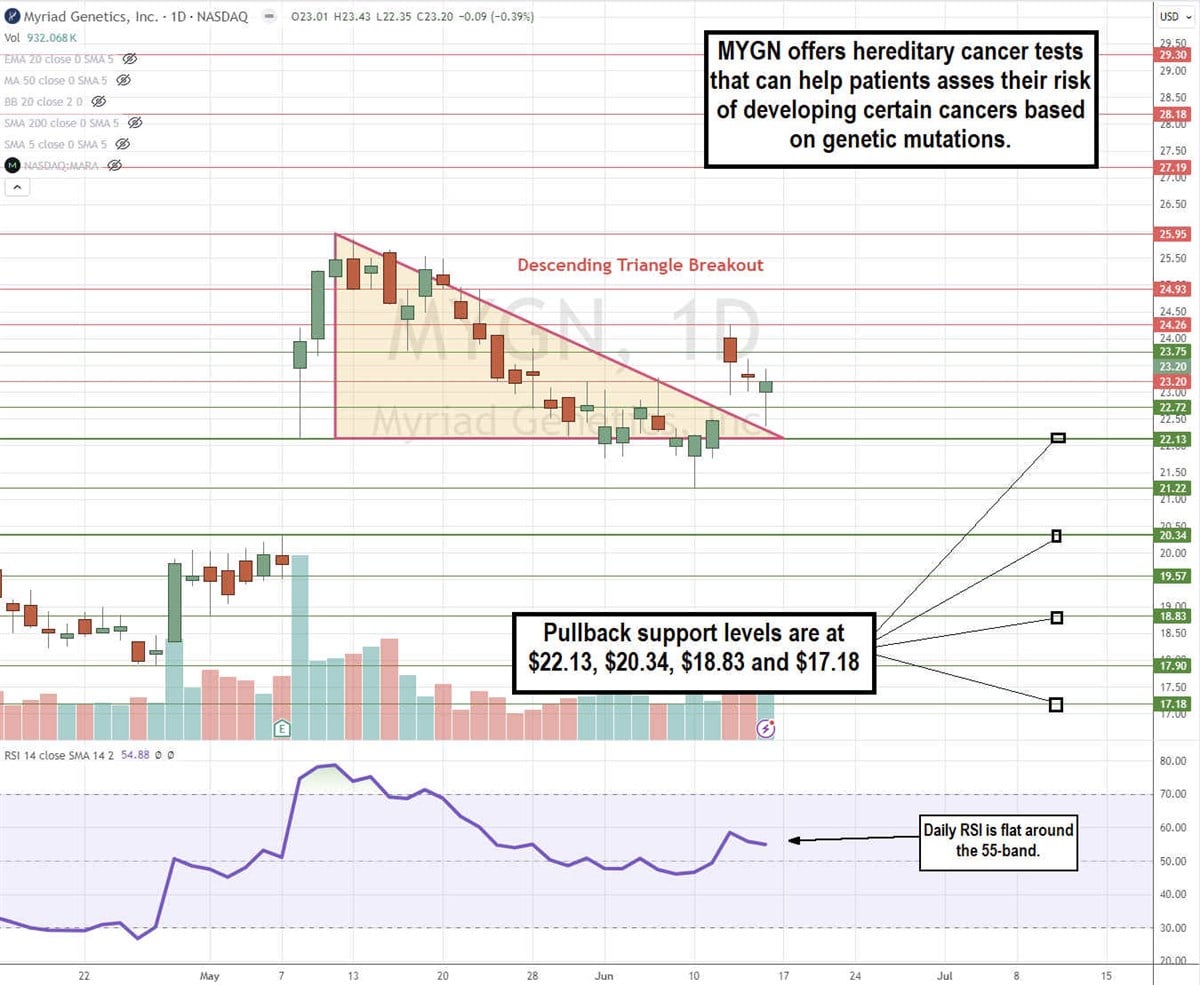
MYGN Attempts to Breakout of the Descending Triangle
The daily candlestick chart on MYGN shows a breakout through the descending triangle pattern. The descending trendline started after peaking at $25.95 and formed by connecting the lower highs down toward the lower flat-bottom trendline at $22.13, which also represents a gap-fill price support. The breakout occurred when shares rose above the $22.72 resistance as it continued to struggle to remain out of the triangle. The daily relative strength index (RSI) has flattened around the 55-band. Pullback support levels are at $22.13, $20.34, $18.83, and $17.18.
Myriad Genetics analyst ratings and price targets are at MarketBeat.