VIRGINIA BEACH, Va. - Aug. 19, 2021 - PRLog -- Schonfeld & Associates, publisher of business information products for over 45 years, offers an updated industry sector report for the manufacturing sector in its series SG&A Benchmarks. The series of PDF reports is designed for use as a convenient source of information for professional managers seeking benchmark information on Selling, General & Administrative spending by major public corporations. SG&A Benchmarks – Manufacturing provides SG&A spending information for 1647 publicly traded companies in twenty industries within the manufacturing sector having sales of $1 million or more in fiscal 2020.
SG&A expenses are all the direct and indirect selling expenses and all general and administrative expenses. SG&A expenses are also called Operating Expenses. Frequently, SG&A to Sales ratios are used to judge efficiency of management spending.
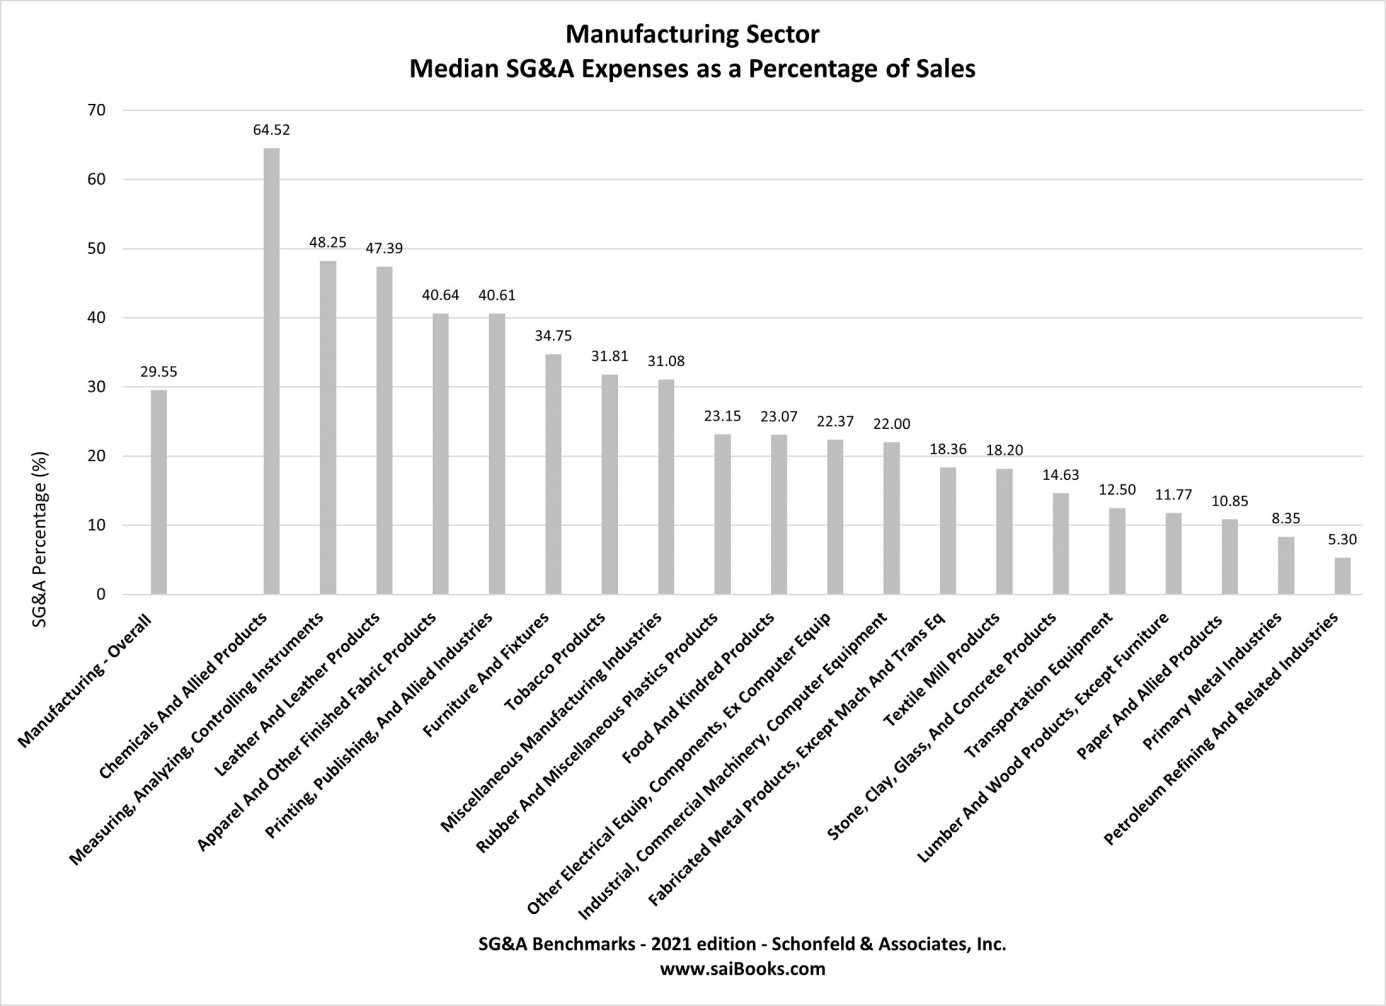
Benchmarks for SG&A spending are hard to find. Averages may be available but are generally too broad to be useful. Within the study, individual companies are listed with SG&A to Sales percentage and growth rates in sales and spending for fiscal years 2019 and 2020. The sector summary chart provides side by side comparison of 10%ile, median, and 90%ile values for each industry within the sector. To allow for easy identification of relative performance within each industry and to account for SG&A spending practices varying by size and location, individual companies are grouped by size based on fiscal 2020 sales. Total sales for fiscal 2020 and headquarters city is also provided.
Within each sector report, a summary displays median SG&A to Sales ratio by industry as well as 10 and 90 percentile values to illustrate the range of values reported by firms within each industry. The tabulations for each individual industry present both fiscal 2019 and fiscal 2020 SG&A as a percentage of sales and the annual percentage growth rate in SG&A spending as well as in sales for each company within the industry. Comparing the growth rate of SG&A expenses and sales gives a snapshot of where the profitability of the firm may be heading.
These reports will benefit anyone seeking competitive benchmark intelligence including corporate staff, financial analysts, investment professionals, lenders, M&A advisors, appraisers and industry consultants.
Visit the SG&A Benchmarks area of expertise on the company website at https://saibooks.com where a secure order can be placed for immediate download.
Contact
Carol J. Greenhut
***@saibooks.com
Photos: (Click photo to enlarge)![]()
Read Full Story - SG&A Benchmarks – Manufacturing Sector now available with fiscal 2020 information | More news from this source
Press release distribution by PRLog
SG&A Benchmarks – Manufacturing Sector now available with fiscal 2020 information
August 19, 2021 at 09:31 AM EDT
