ETFOptimize | High-performance ETF-based Investment Strategies

Quantitative strategies, Wall Street-caliber research, and insightful market analysis since 1998.


ETFOptimize | HOME
Close Window

Use cohort analysis to drive smarter startup growth

Cohort analysis is a way of evaluating your business that involves grouping customers into "cohorts" and observing how they behave over time.
Jonathan Metrick Contributor Jonathan Metrick is the chief growth officer at Sagard & Portage Ventures, where he helps build some of the world's leading fintech companies.

Cohort analysis is a way of evaluating your business that involves grouping customers into “cohorts” and observing how they behave over time. A commonly used approach is monthly cohort analysis, where customers are grouped by the month they signed up, allowing you to observe how someone who joined in November compares to someone who signed up the month before.

Cohort analysis gives you a multivariable, forward-looking view of your business compared to more simple and static values like averages or totals.

Cohort analysis is flexible and can be used to analyze a variety of performance metrics including revenue, acquisition costs and churn.

Let’s imagine you’re the CMO of the “Bluetooth Coffee Company.” You sell a tech-enabled “coffee composer” that brews coffee, tracks consumption and orders replacement coffee when users are running low. The longer your customers are subscribers, the more money you make. You recently ran a Black Friday feature on a popular deals site and you’re interested to know if you should run it again.

The chart below is a simple analysis you might do to gauge your marketing performance. It shows the total customers added each month, and a clear spike in November following the Black Friday promotion. At first glance, things look good — you brought in more than double the monthly customers in November compared to October.

Marketing campaign results in significant uptick to users added

Image Credits: Sagard & Portage Ventures
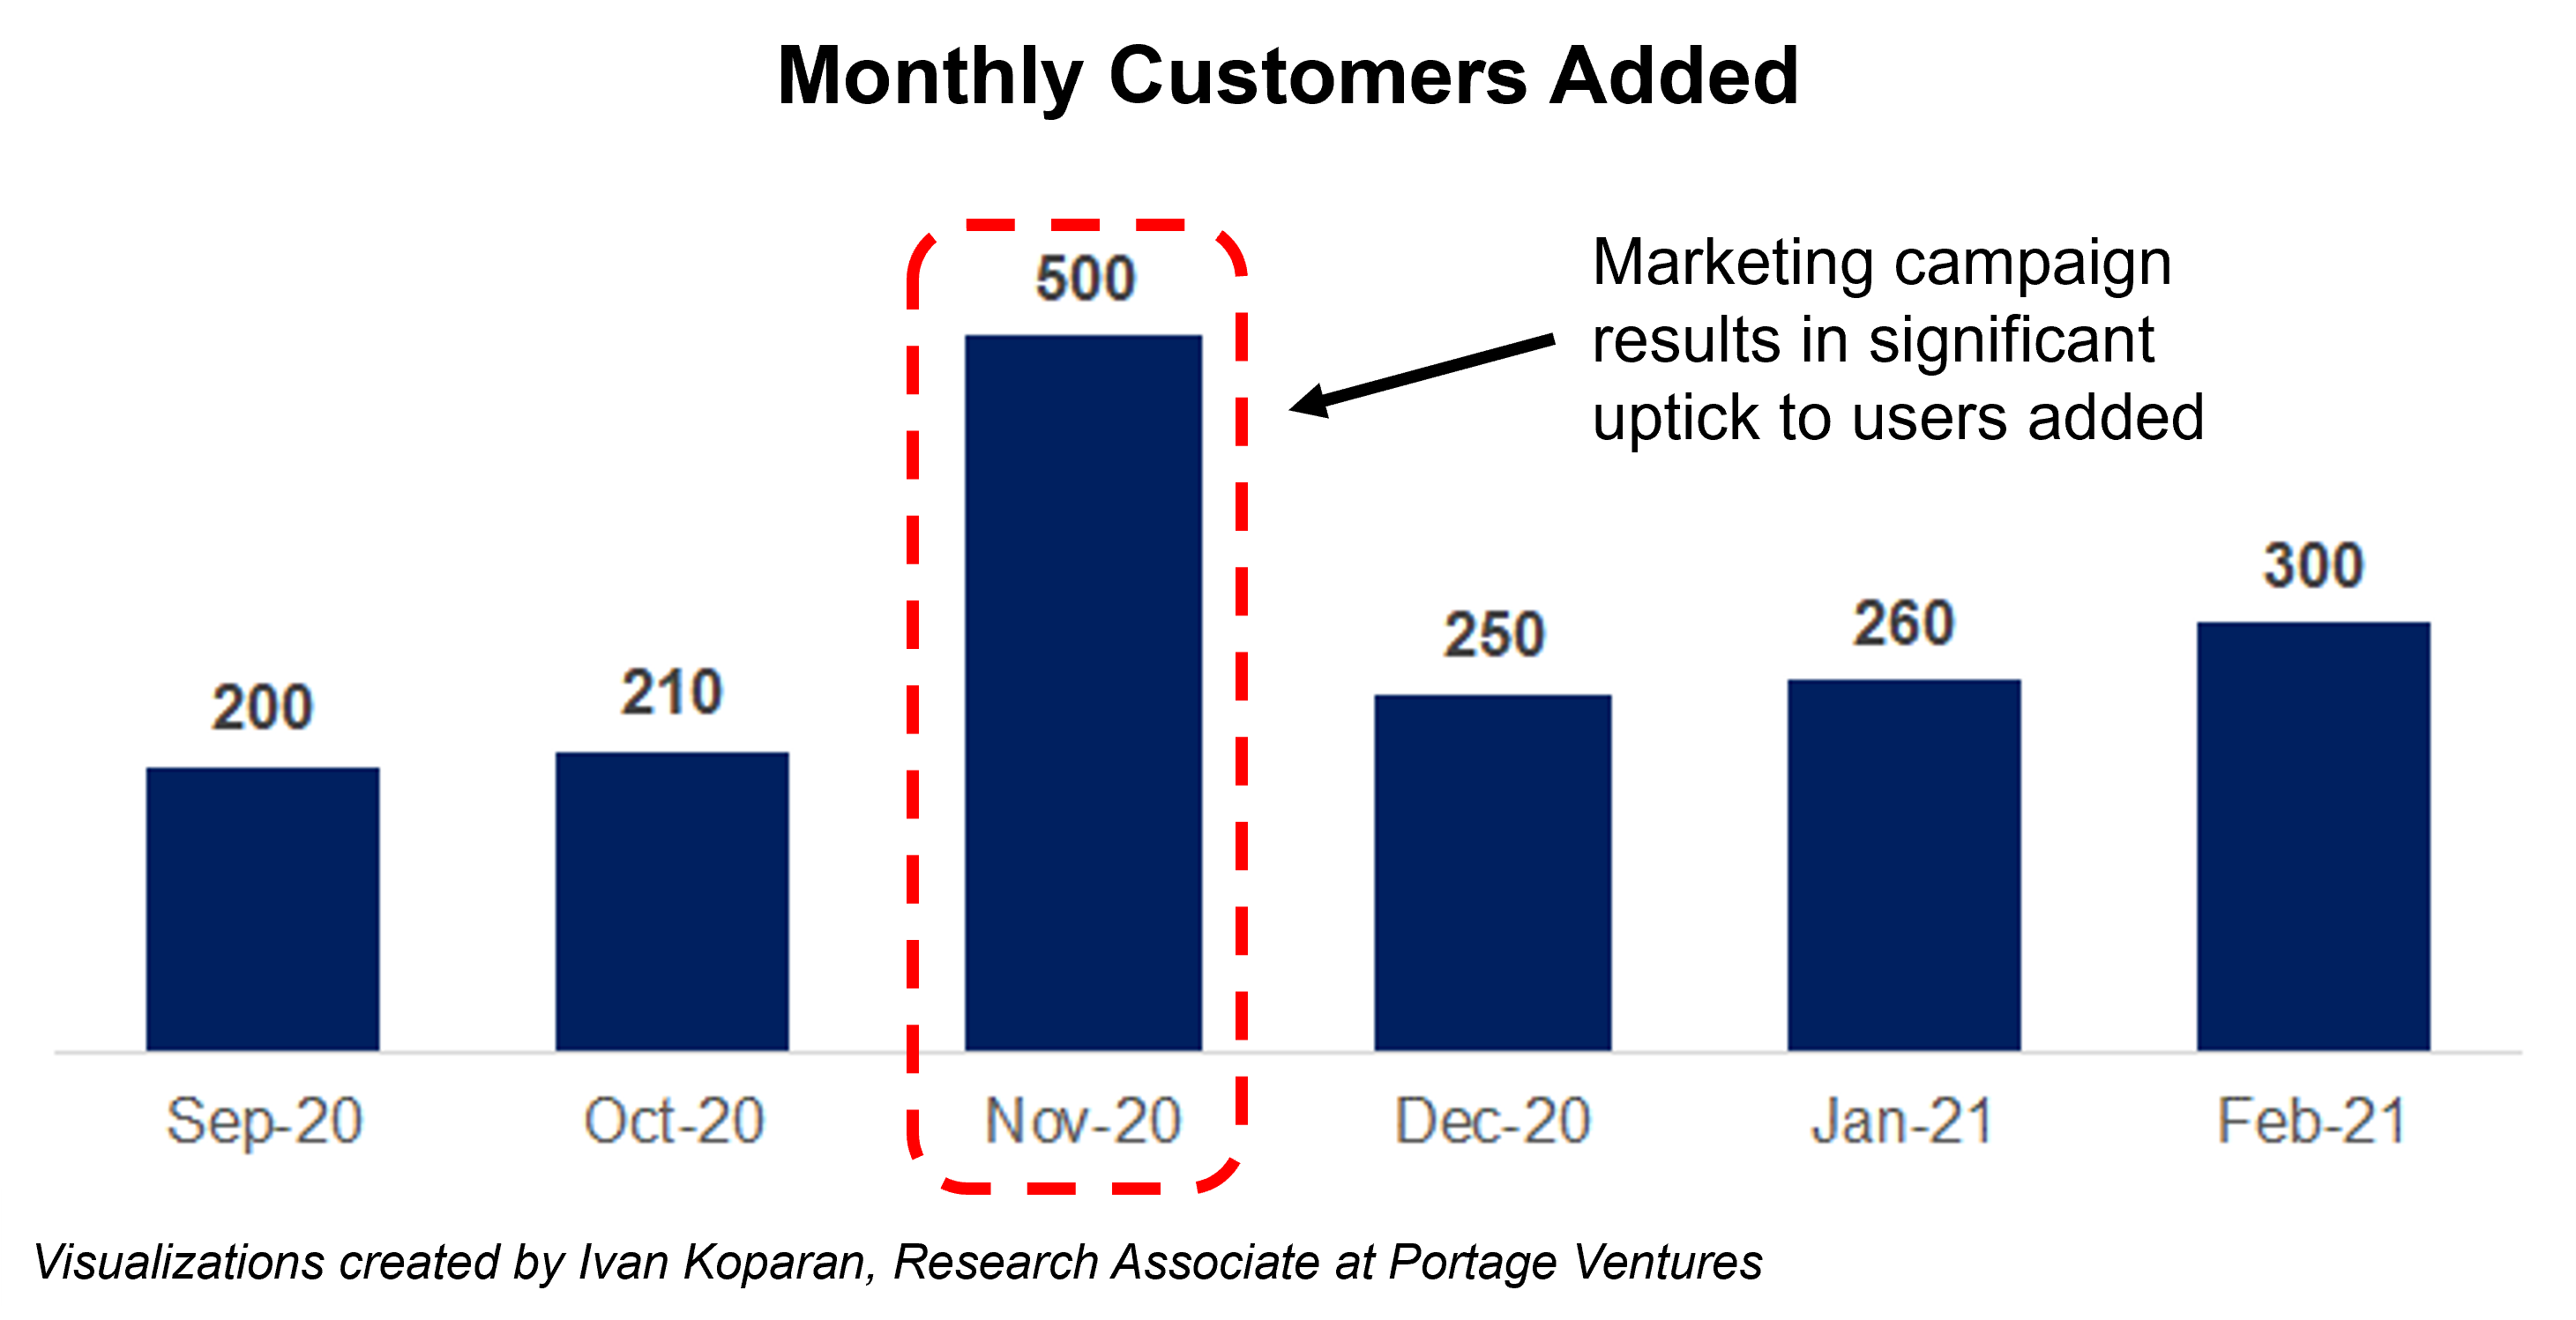
But before you rebook the promotion, you should ask if these new Black Friday consumers are as valuable as they seem. Comparing monthly customer percentage is a good way to find out.

Below is a monthly cohort analysis of new customers between September 2020 and February 2021. Like our previous chart, we’ve listed the monthly cohort size, but we’ve also included the customer engagement rate (calculated by dividing daily active users by monthly active users or DAU/MAU for each month (M1 is month 1, M2 is month 2, and so on).

This analysis lets us see how the customer engagement of each monthly cohort compares to the next.

Customer engagement by cohort

Image Credits: Sagard & Portage Ventures
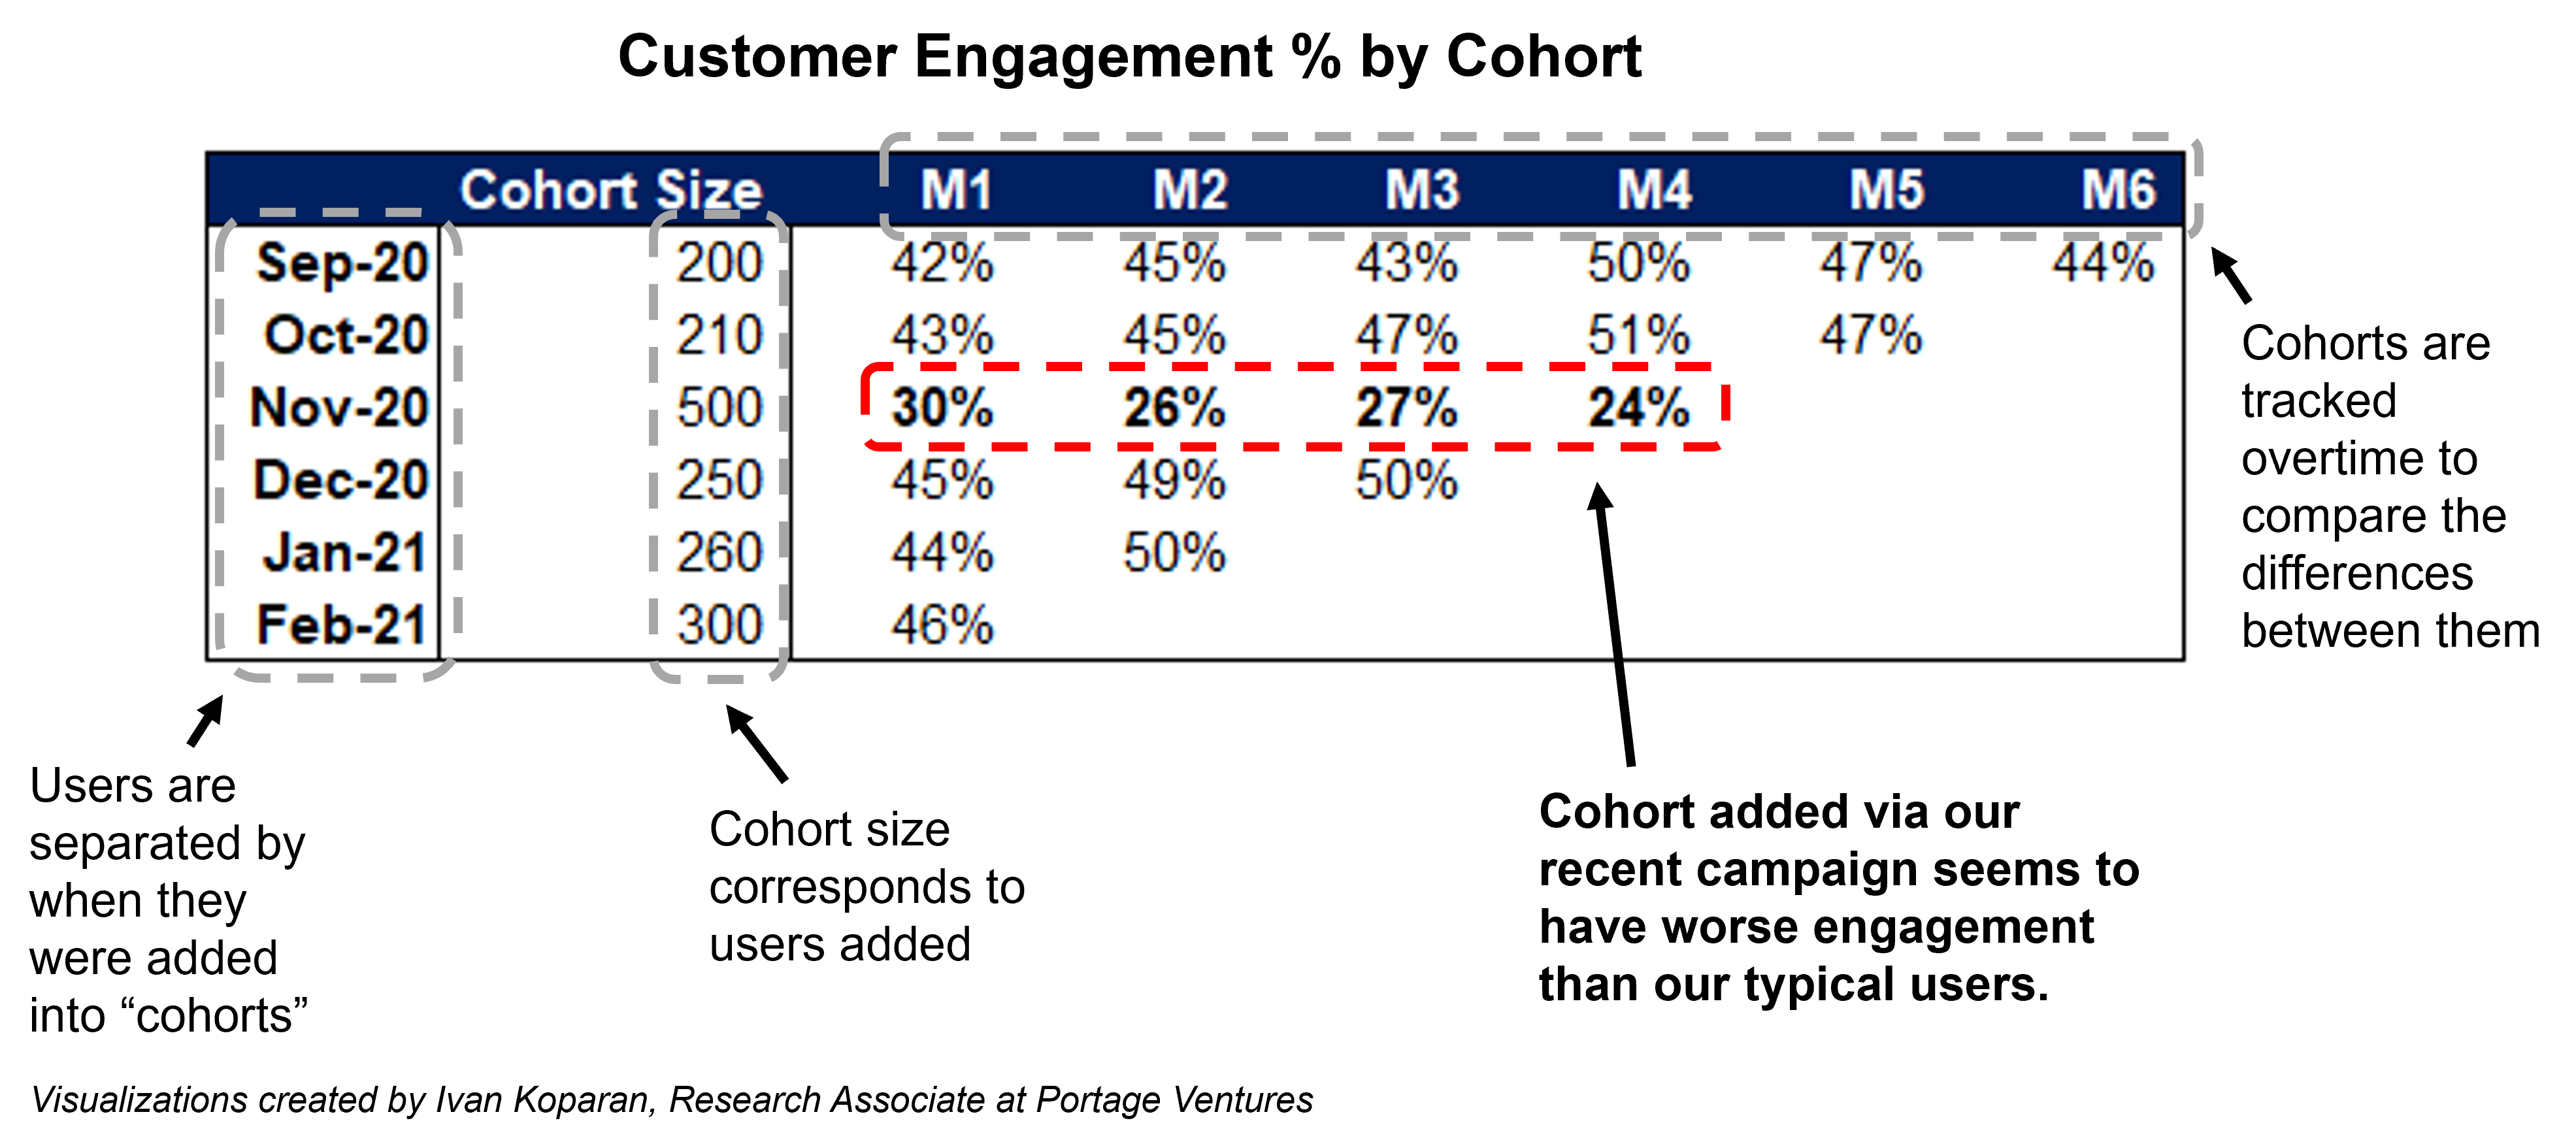
From the figures above, we see that most cohorts have a customer engagement rate in their first month (M1, 42%-46%), meaning 42%-46% of new customers use the coffee composer everyday. The November cohort however has materially lower engagement (M1, 30%), and remains lower in subsequent months (M2, 26%) and (M3, 27%). Interestingly, the customer engagement rate only drops with the November cohort, returning to normal with the December cohort (M1, 45%).

Data & News supplied by www.cloudquote.io
Stock quotes supplied by Barchart
Quotes delayed at least 20 minutes.
By accessing this page, you agree to the following
Privacy Policy and Terms and Conditions.


IntelligentValue Home
Close Window

DISCLAIMER

All content herein is issued solely for informational purposes and is not to be construed as an offer to sell or the solicitation of an offer to buy, nor should it be interpreted as a recommendation to buy, hold or sell (short or otherwise) any security.  All opinions, analyses, and information included herein are based on sources believed to be reliable, but no representation or warranty of any kind, expressed or implied, is made including but not limited to any representation or warranty concerning accuracy, completeness, correctness, timeliness or appropriateness. We undertake no obligation to update such opinions, analysis or information. You should independently verify all information contained on this website. Some information is based on analysis of past performance or hypothetical performance results, which have inherent limitations. We make no representation that any particular equity or strategy will or is likely to achieve profits or losses similar to those shown. Shareholders, employees, writers, contractors, and affiliates associated with ETFOptimize.com may have ownership positions in the securities that are mentioned. If you are not sure if ETFs, algorithmic investing, or a particular investment is right for you, you are urged to consult with a Registered Investment Advisor (RIA). Neither this website nor anyone associated with producing its content are Registered Investment Advisors, and no attempt is made herein to substitute for personalized, professional investment advice. Neither ETFOptimize.com, Global Alpha Investments, Inc., nor its employees, service providers, associates, or affiliates are responsible for any investment losses you may incur as a result of using the information provided herein. Remember that past investment returns may not be indicative of future returns.

Copyright © 1998-2017 ETFOptimize.com, a publication of Optimized Investments, Inc. All rights reserved.