Denver, Colo.-based Liberty Energy Inc. (LBRT), which was formerly known as Liberty Oilfield Services Inc., operates as a provider of hydraulic fracturing, wireless services, and associated goods to onshore oil and natural gas exploration and production companies. The company provides its services primarily in the Permian Basin, the Eagle Ford Shale, the Denver-Julesburg Basin, the Williston Basin, and the Powder River Basin.
LBRT reported a first-quarter net loss of $5 million or three cents per share. Although the company expects drilling services’ strong demand to drive higher revenue and larger margins in this quarter, the U.S. hydraulic fracturing market faces labor shortages, supply chain issues, and equipment attrition, which could be a significant headwind. The company also noted that the market is tight due to underinvestment.
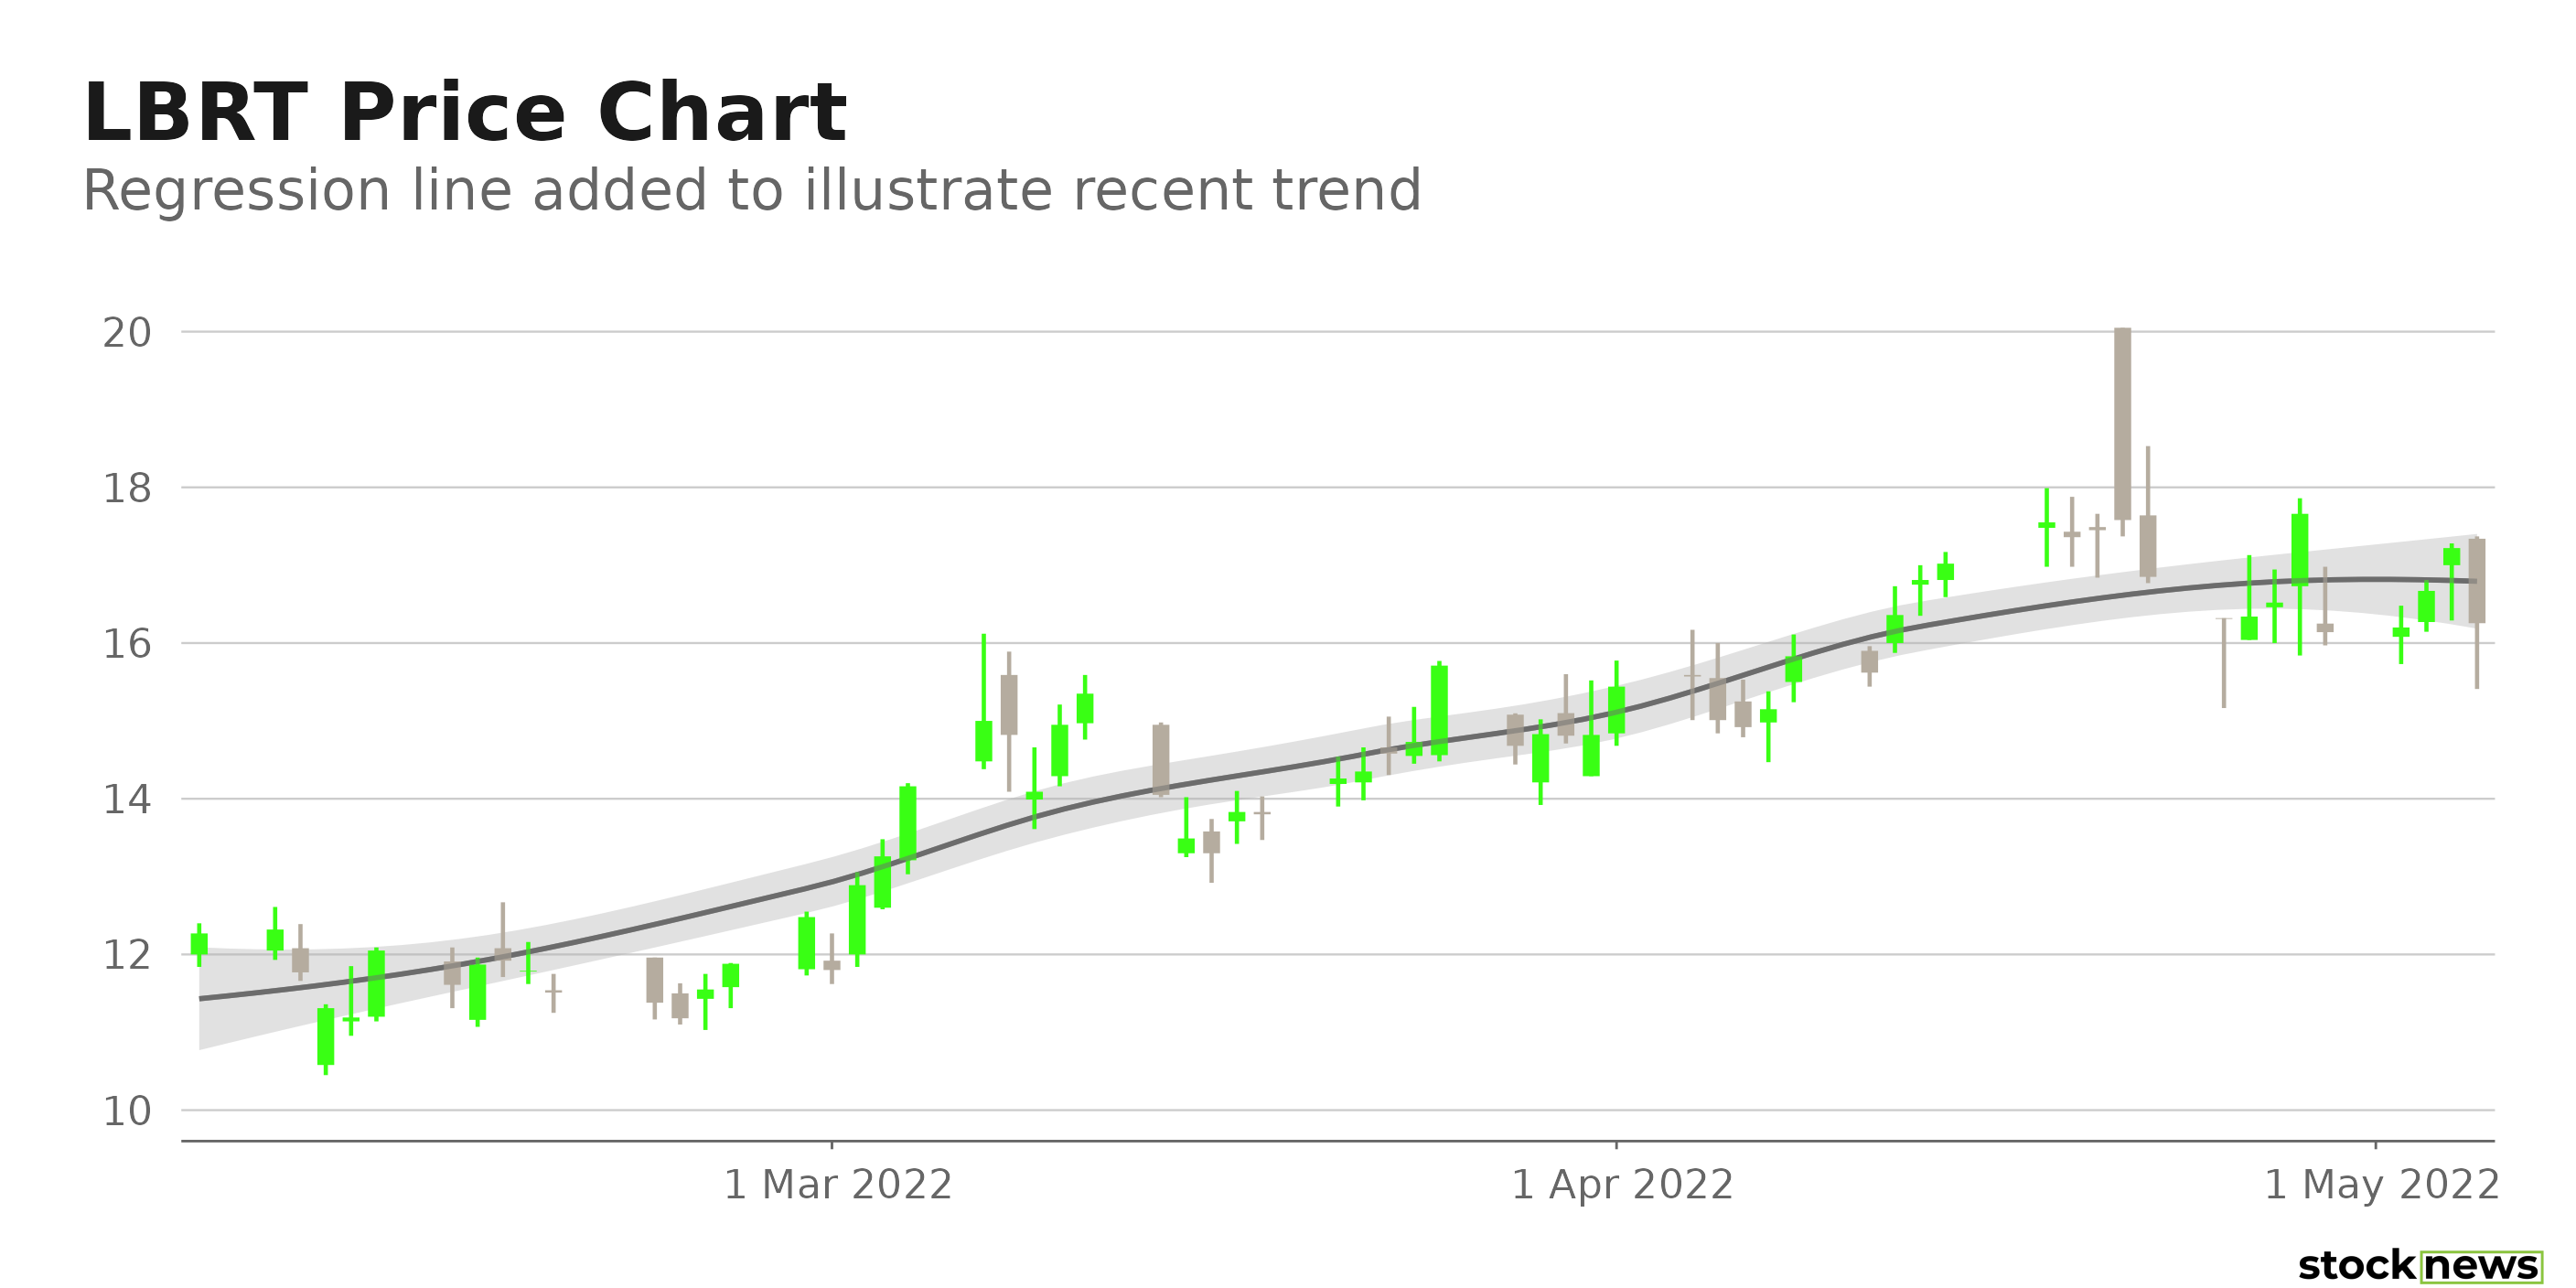
LBRT’s stock has gained 37.2% in price over the past year and 77.5% year-to-date to close yesterday’s trading session at $17.22. It has gained 10.6% in price over the past month but declined 2.4% over the past five days.
Here are the factors that could affect LBRT’s performance in the near term.
Stretched Valuations
In terms of its forward non-GAAP P/E, LBRT is currently trading at 30.18x, which is 210.6% higher than the 9.71x industry average. The stock’s 1.78 forward non-GAAP PEG multiple is 103.9% higher than the 0.87 industry average. LBRT’s 24.39 forward EV/EBIT multiple is 140.1% higher than the 10.16 industry average.
Bleak Profit Margins
LBRT’s trailing 12-month gross profit margin and EBITDA margin of 10.71% and 5.72%, respectively, are 73.70% and 75.92% lower than the 40.74% and 23.76% industry averages. Its negative 5.55% trailing 12-month net income margin is substantially lower than the 6.87% industry average.
LBRT’s negative 12.35%, 4.93%, and 6.87% respective ROE, ROTC, and ROA compare with their 9.73%, 4.96%, and 3.57% industry averages.
Mixed Past Growth
Although LBRT’s revenue has grown at a 7.3% CAGR over the past three years, its EBITDA has declined at a 27.9% CAGR over the same period. Furthermore, LBRT has missed consensus EPS estimates in three out of the trailing four quarters.
Negative Trailing 12-month Bottom Line
LBRT’s trailing 12-month revenue came in at $2.71 billion. But its trailing 12-month net income and EPS came in at a negative $150.42 million and $0.84, respectively. Its trailing 12-month levered free cash flow stood at a negative $34.31 million.
POWR Ratings Reflect Bleak Prospects
LBRT’s POWR Ratings reflect this bleak outlook. The stock has an overall D rating, which equates to Sell in our proprietary rating system. The POWR Ratings are calculated by considering 118 distinct factors, with each factor weighted to an optimal degree.
LBRT has a Stability grade of D, which is in sync with its five-year monthly beta of 2.62. The stock also has a D grade for Quality, consistent with its lean profit margins.
In the 46-stock Energy – Services industry, LBRT is ranked #37.
Click here to see the additional POWR Ratings for LBRT (Growth, Value, Momentum, and Sentiment).
View all the top stocks in the Energy – Services industry here.
Bottom Line
LBRT has forecasted 10% revenue growth and higher margins for the second quarter, but the inflationary pressures could offset its growth. Moreover, its lean profit margins, negative ROE, and stretched valuations are concerning. Hence, I think it might be best to avoid the stock now.
How Does Liberty Energy Inc. (LBRT) Stack Up Against its Peers?
While LBRT has an overall POWR Rating of D, one might consider looking at its industry peers, North American Construction Group Ltd. (NOA) and NCS Multistage Holdings, Inc. (NCSM), which have an overall B (Buy) rating.
LBRT shares were trading at $16.20 per share on Thursday afternoon, down $1.02 (-5.92%). Year-to-date, LBRT has gained 67.01%, versus a -13.07% rise in the benchmark S&P 500 index during the same period.
About the Author: Anushka Dutta

Anushka is an analyst whose interest in understanding the impact of broader economic changes on financial markets motivated her to pursue a career in investment research.
The post Does Liberty Oilfield Services Deserve a Place in Your Portfolio? appeared first on StockNews.com