VIRGINIA BEACH, Va. - May 9, 2022 - PRLog -- Schonfeld & Associates, Inc. just released the latest annual edition of Advertising Ratios & Budgets. The report covers over 2,300 individual companies within 310 industries that spent on advertising in 2021. Over 300 non-U.S. headquartered firms are included.
The study reports fiscal 2020 and 2021 advertising spending, revenue for 2021, advertising-to-sales ratios for 2021 and annual growth rates for ad spending and sales by company and by industry so users of the study can monitor competition and evaluate their own marketing strategies.
Advertising by catalog and mail-order houses, the top spending industry, increased to over $38 billion and the industry saw an increase of over 20% in revenue. Online powerhouse Amazon continued to grow its advertising budget by over 40 percent. JD.com, a major Chinese retailer and internet company, also increased ad spending over 40 percent.
The pharmaceutical industry reported spending exceeding $19 billion in 2021, up 39%. As in other industries, use of social media has become integral to the marketing strategies of pharmaceutical companies.
Motor vehicle manufacturers increased their ad budgets over 12% but reported flat revenues. Cable and pay TV services, such as Comcast, increased their ad spending by 18% to $13.3 billion.
Large, diversified food companies spent a total of $2.5 billion in 2021, up over 12 percent. Most activities outside the home that came to a halt during 2020 slowly started to reappear in 2021. The beverage industry spent $9.3 billion, a 21% increase, and saw sales up 13%. Beer companies spent almost $1.4 billion, a 22% increase. The 44 separate restaurant chains in the study spent a total of $3.4 billion in 2021, an increase of over 15% and saw a 20% increase in sales.
Variety stores, led by Wal-Mart, increased their ad budgets over 14% to over $5.8 billion with revenues up by over 3%. Traditional bricks and mortar department stores, such as Macy's, saw increased sales of more than 35% with increased ad spending of 28%. Travel related industries saw significant revenue gains in 2021 and increased advertising spending as pandemic restrictions began to lift..
Advertising Ratios & Budgets is widely used for strategic planning by ad agencies, monitoring competitors, planning ad budgets, and identifying new business prospects. Information is grouped to show all competitors within an industry.
The 150-page PDF study is available for $ 395. Excel data files are also available for all companies and industries. Five years of revenue, ad spending and ratio information is provided to allow for additional analysis. The 2022 edition of the PDF study along with Excel datafiles is $ 495. Contact Schonfeld & Associates, Inc., 1932 Terramar Lane, Virginia Beach, VA 23456. 800-205-0030. Visit www.saiBooks.com under the Area of Expertise: Advertising Spending.
Contact
Carol J Greenhut
***@saibooks.com
Photos: (Click photo to enlarge)![]()
Read Full Story - 2021 Ad-to-Sales Ratio Benchmarks by Company and Industry | More news from this source
Press release distribution by PRLog
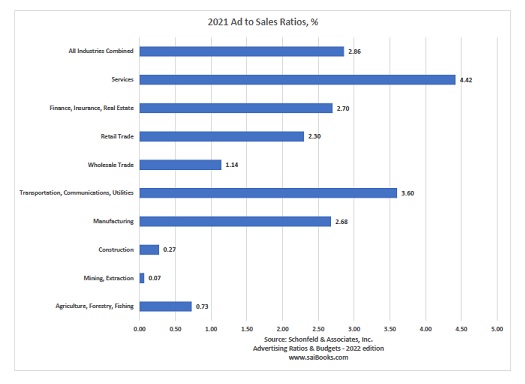
2021 Ad-to-Sales Ratio Benchmarks by Company and Industry
May 09, 2022 at 22:32 PM EDT
