The melt up for stock prices continues as investors find fewer reasons to sell these days thanks to bank crisis headlines fading in the rear-view mirror.
+ inflation is clearly coming down.
+ early earnings season results are better than expected
So, does this mean we are ready to coronate the new bull market?
Not so fast!
The rest of the story is shared below in this week’s...
Market Commentary
It appears that the melt up to previous highs near 4,200 is firmly in place barring some shocking headline like another banking collapse. You can just see that there is virtually no resistance to going higher of late and how at the end of most sessions we almost always tack on some extra gains.
The last time the S&P 500 (SPY) market fell more than 1% was back on March 22nd. Since then, 12 of the last 18 sessions have been in positive territory with an impressive total gain of +5.5%.
This all feels quite bullish. But before loading up the truck on stocks, please realize there is serious resistance overhead at 4,200. That is where we got stopped out in early February. But also above that many would consider the start of a new bull market (20% above the October lows of 3,491).
Reity, are you saying that if we breakout above 4,200 then the bear market is dead...long live the bull market?
I wish it were that easy.
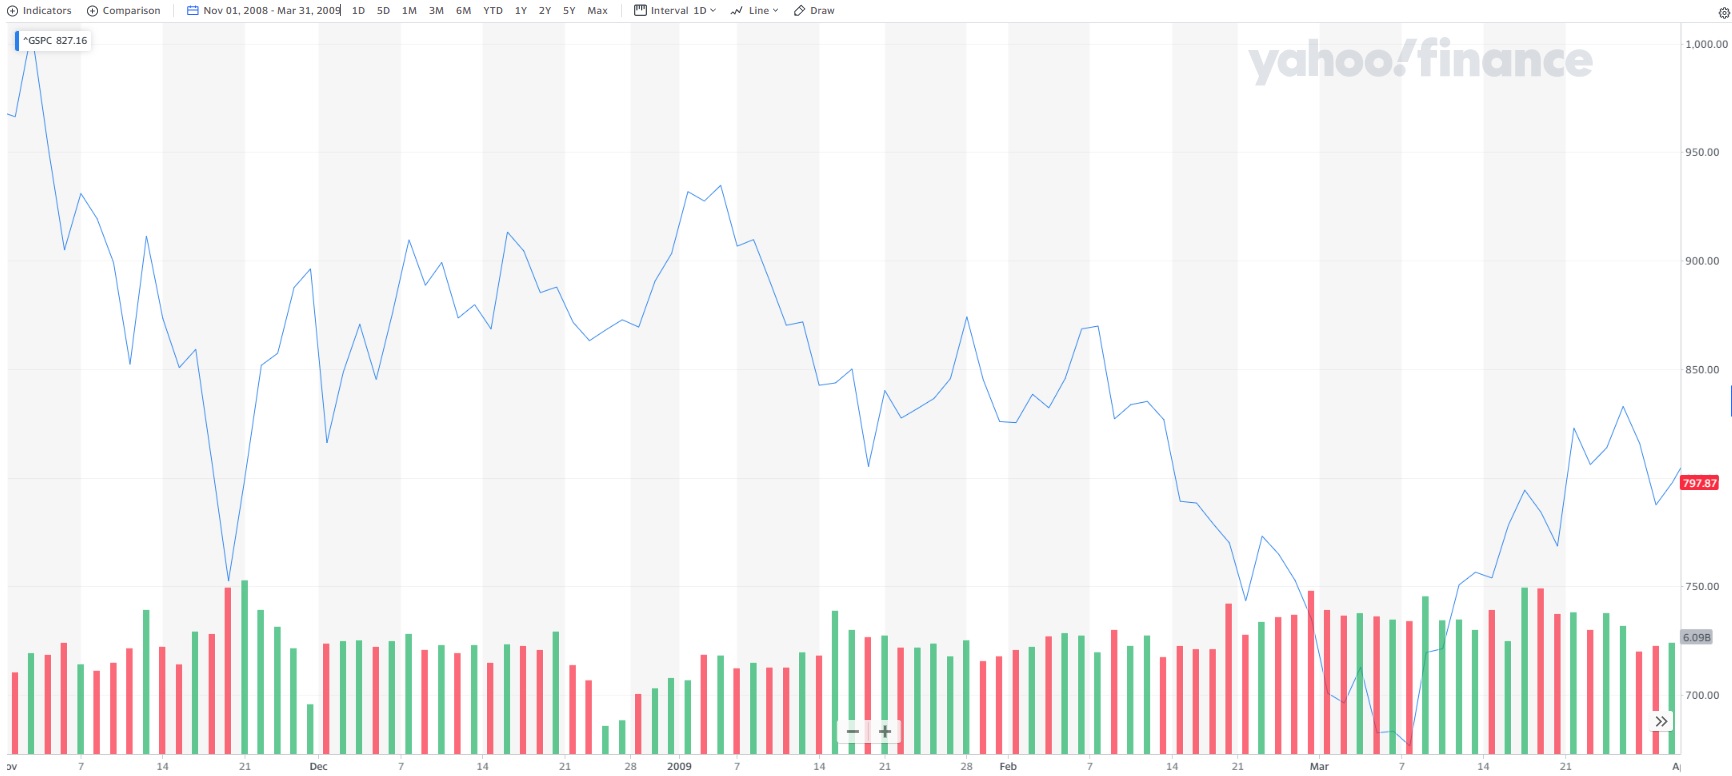
For example, below is a chart going back to the Great Recession. In late November 2008 through early January 2009 the market rallied over 20% to be called a new bull market. Yet that was a false positive as it quickly gave way to a new round of selling finding much lower lows by March.
So, if a breakout above 4,200 is not an “all clear” signal...then how does someone invest right now?
As long as the Fed remains hawkish it leaves the door open to a future recession. That is because keeping rates higher for longer is akin to stepping on the brakes of the economy.
Stocks will never race ahead into clear bull market until the Fed lets off those brakes and the fear of recession fades. This limits upside for now.
What will create renewed downside is that the fears of recession become reality. That mostly will be seen from a combination of negative GDP and job loss. Thus, it pays to keep a close eye on the GDP Now model from the Atlanta Fed to monitor one of the most proven models for predicting economic growth or decline.
Then on the employment front, many people will want to see the pain in the Government Employment Situation report which comes out the first Friday of each month. However, leading indicators of what shows up there can be found by monitoring weekly Jobless Claims every Thursday. The closer that gets to 300,000 per week...the more likely that job loss is taking place and the unemployment rate will move higher.
Obviously, a fresh round of negative headlines on the banking sector would have us quickly in sell off mode. That is because shockwaves there will further limit access to credit which is another form of stepping on the brakes of the economy increasing the odds of recession. Let’s not forget that the previous FOMC Minutes showed that many members are increasingly worried that the bank events to date are already enough to lead to recession by years end.
When you add it altogether it is fair to say we are in a state of limbo. Could be bullish. Could be bearish. But most definitely is uncertain.
What To Do Next?
Discover my balanced portfolio approach for uncertain times. The same approach that has beaten the S&P 500 by 29.7% so far in April.
This strategy was constructed based upon over 40 years of investing experience to appreciate the unique nature of the current market environment.
Right now, it is neither bullish or bearish. Rather it is confused...volatile...uncertain.
Yet, even in this unattractive setting we can still chart a course to outperformance. Just click the link below to start getting on the right side of the action:
Steve Reitmeister’s Trading Plan & Top Picks >
Wishing you a world of investment success!

Steve Reitmeister…but everyone calls me Reity (pronounced “Righty”)
CEO, StockNews.com and Editor, Reitmeister Total Return
SPY shares fell $0.02 (0.00%) in after-hours trading Tuesday. Year-to-date, SPY has gained 8.72%, versus a % rise in the benchmark S&P 500 index during the same period.
About the Author: Steve Reitmeister

Steve is better known to the StockNews audience as “Reity”. Not only is he the CEO of the firm, but he also shares his 40 years of investment experience in the Reitmeister Total Return portfolio. Learn more about Reity’s background, along with links to his most recent articles and stock picks.
The post 4,200 = New Bull Market? appeared first on StockNews.com