Headquartered in Leamington, Canada, Tilray Brands, Inc. (TLRY) is a global leader in medical cannabis research and development, cultivation, production, marketing, and distribution, with operations in four segments: Cannabis Business; Distribution Business; Beverage Alcohol Business; and Wellness Business.
In a recent move to bolster its cannabis portfolio, TLRY's medical cannabis division, Tilray Medical, and its Italian subsidiary, FL Group, received authorization from Italy’s Ministry of Health to distribute three new medical cannabis compounds.
Additionally, the company partnered with Pharmaidea, a Petrone Group company, to market and educate over 12,000 pharmacies across Italy about the benefits of medical cannabis and patient care.
Recently, TLRY commenced a registered offering of $150 million aggregate principal amount of Convertible Senior Notes due 2027, which had a negative impact on the company's stock price. The stock closed the last trading session at $2.36, lower than the 50-day and 200-day moving averages of $2.48 and $3.10, respectively.
To better understand the company’s prospects, let’s look at some of its key financial metrics.
Two Years of Fluctuating TLRY Metrics
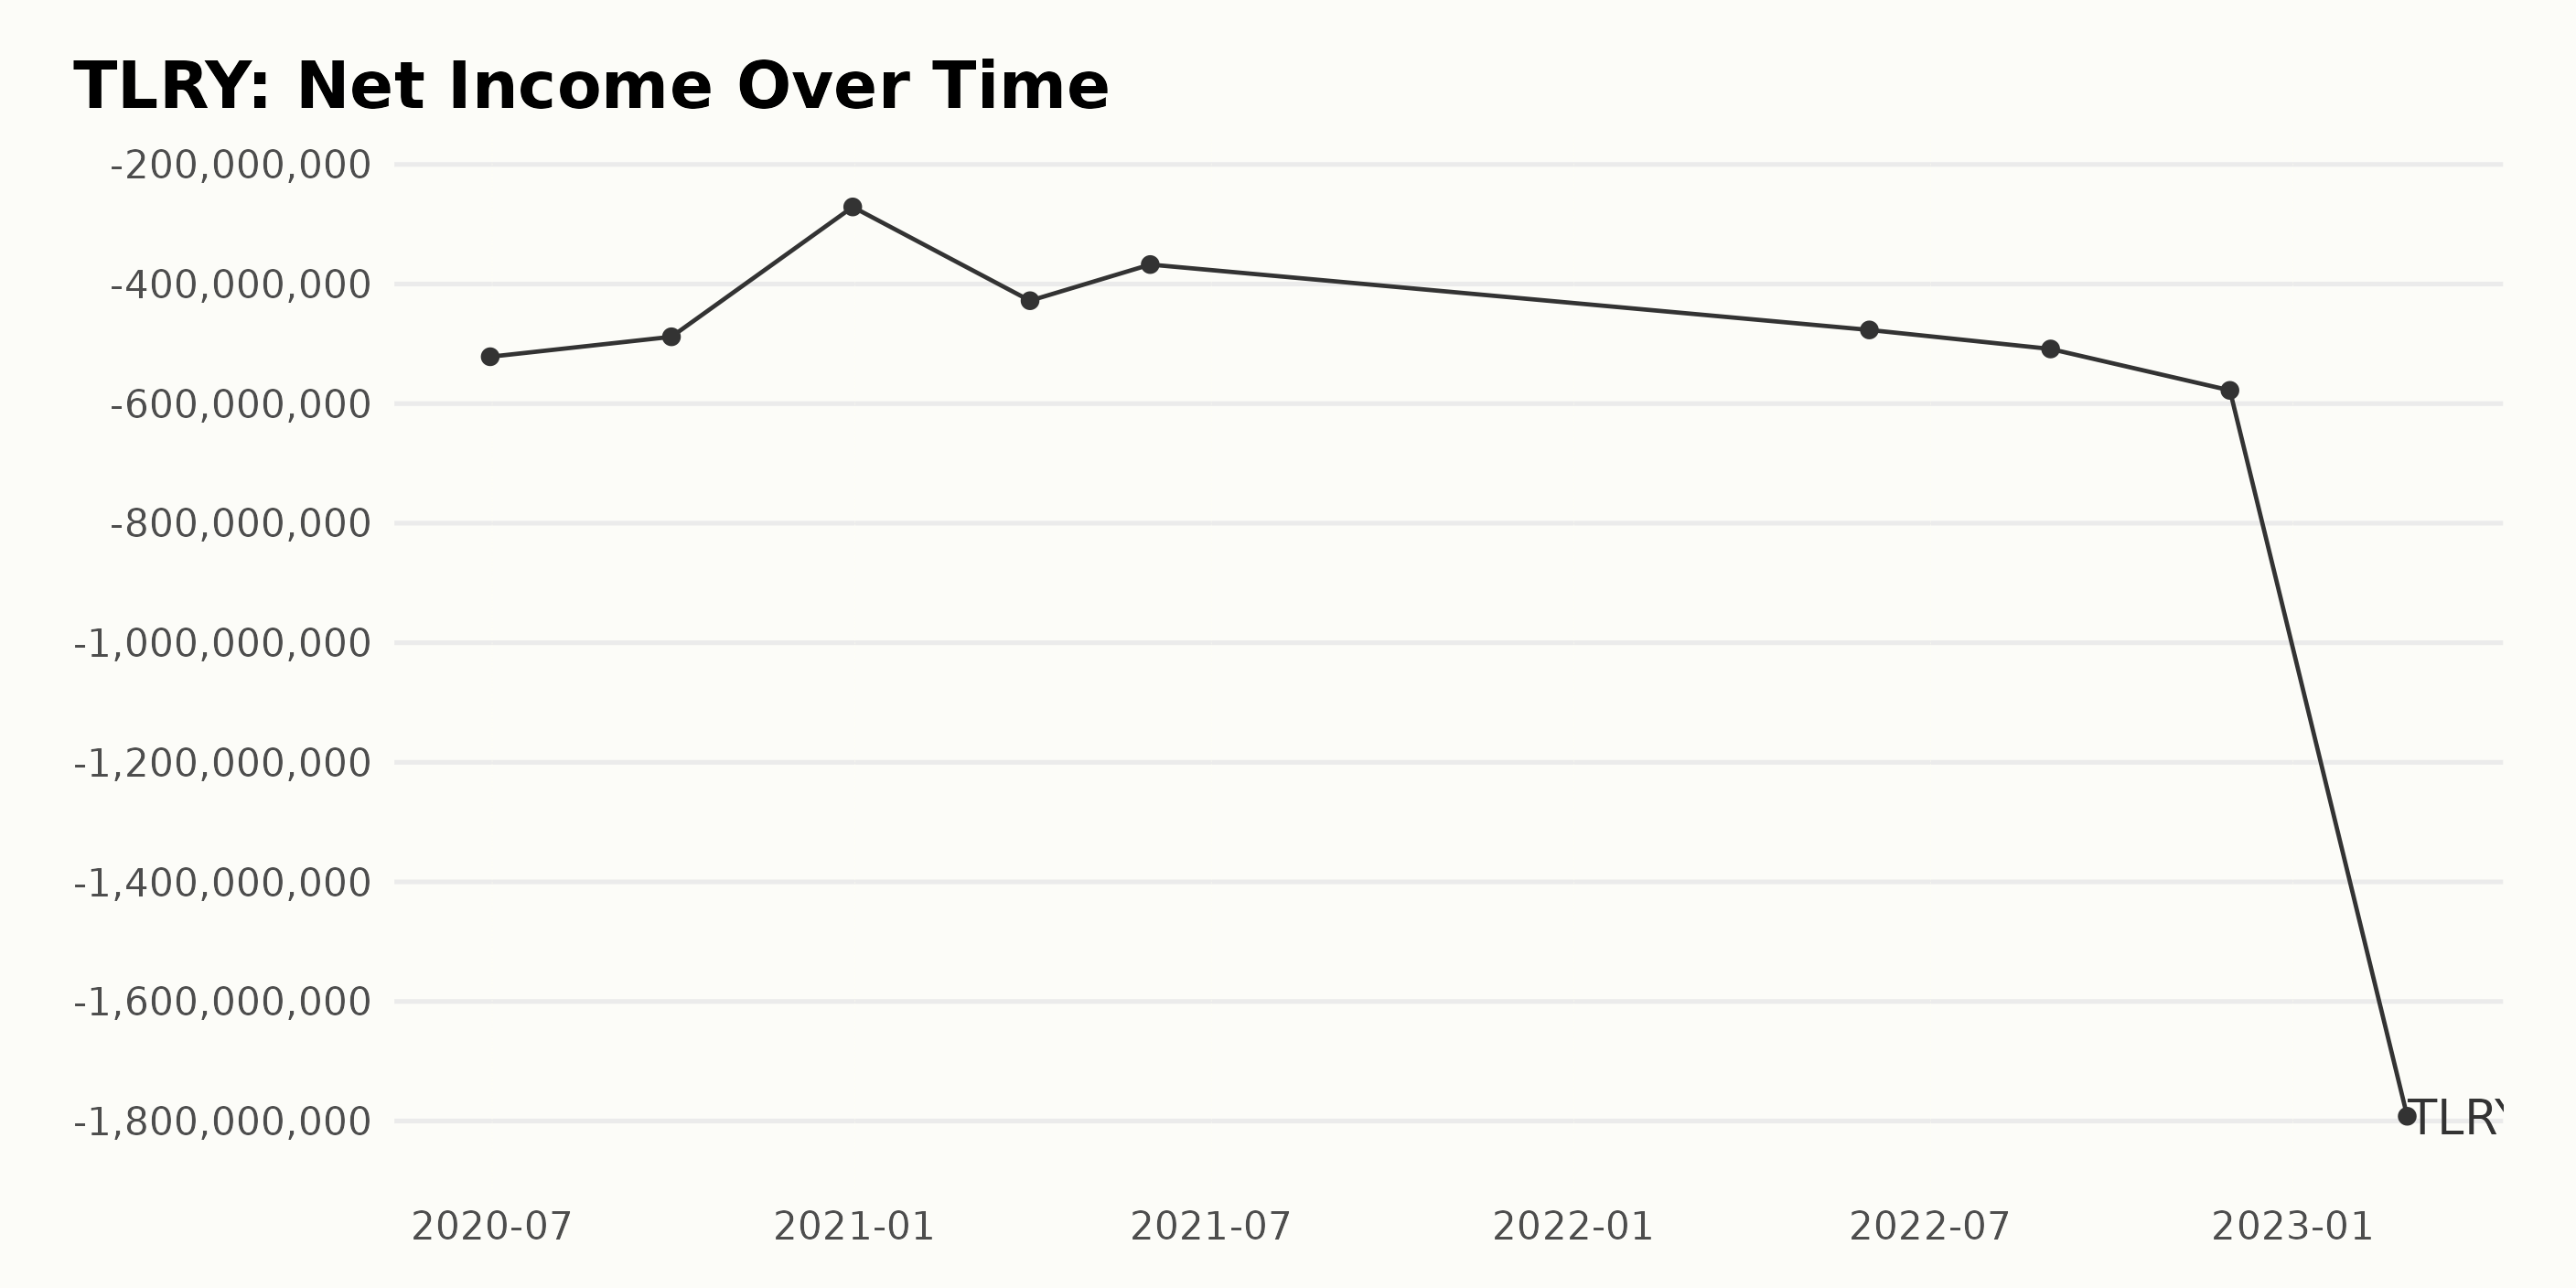
The overall trend of TLRY's net income has decreased since June 2020, when it reported a net income of -$521.63 million. Since then, the net income has decreased to -$1.792 billion in the most recent reporting period of February 2023. This reflects a negative growth rate of 243.11%.
Fluctuations in the net income had happened over the past two years, with the most significant decrease happening between December 2020 and March 2021, when the net income dropped from -$271.07 million to -$427.91 million.
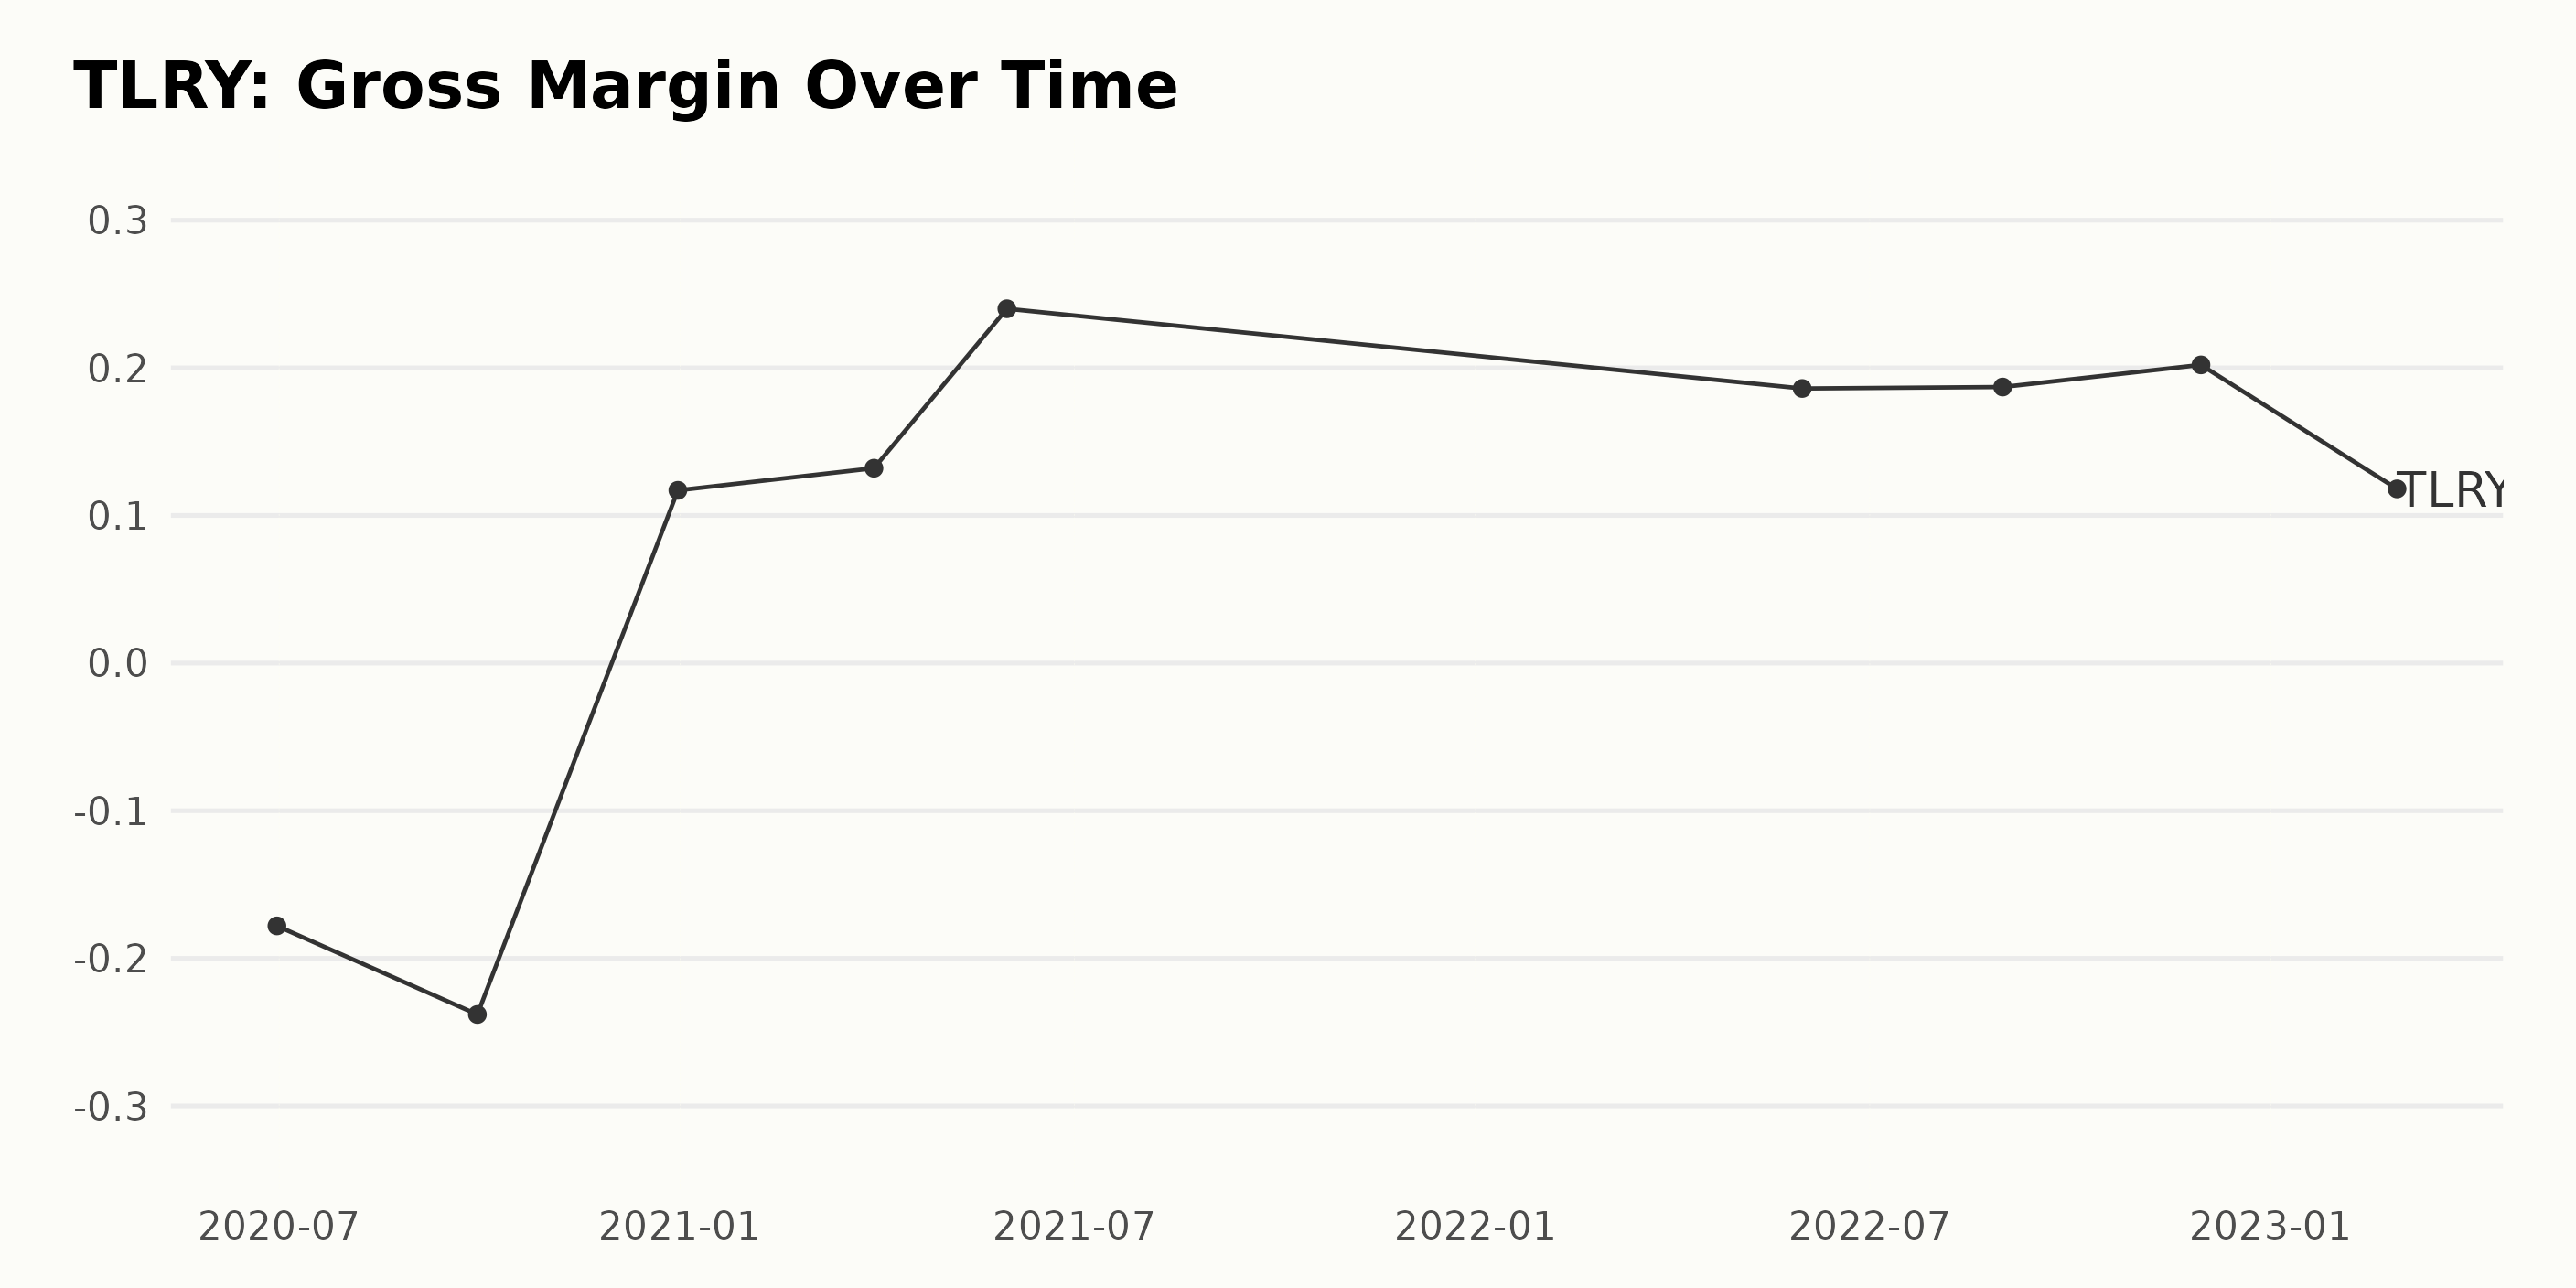
TLRY's gross margin fluctuated between -17.8% on June 30, 2020, and 24.0% on May 31, 2021. The gross margin trended upwards from March 31, 2021, to May 31, 2021 (growth rate of 8.2%), but has since declined to 18.7% by August 31, 2022, before increasing to 20.2% by November 30, 2022, and then dropping to 11.8% by February 28, 2023.
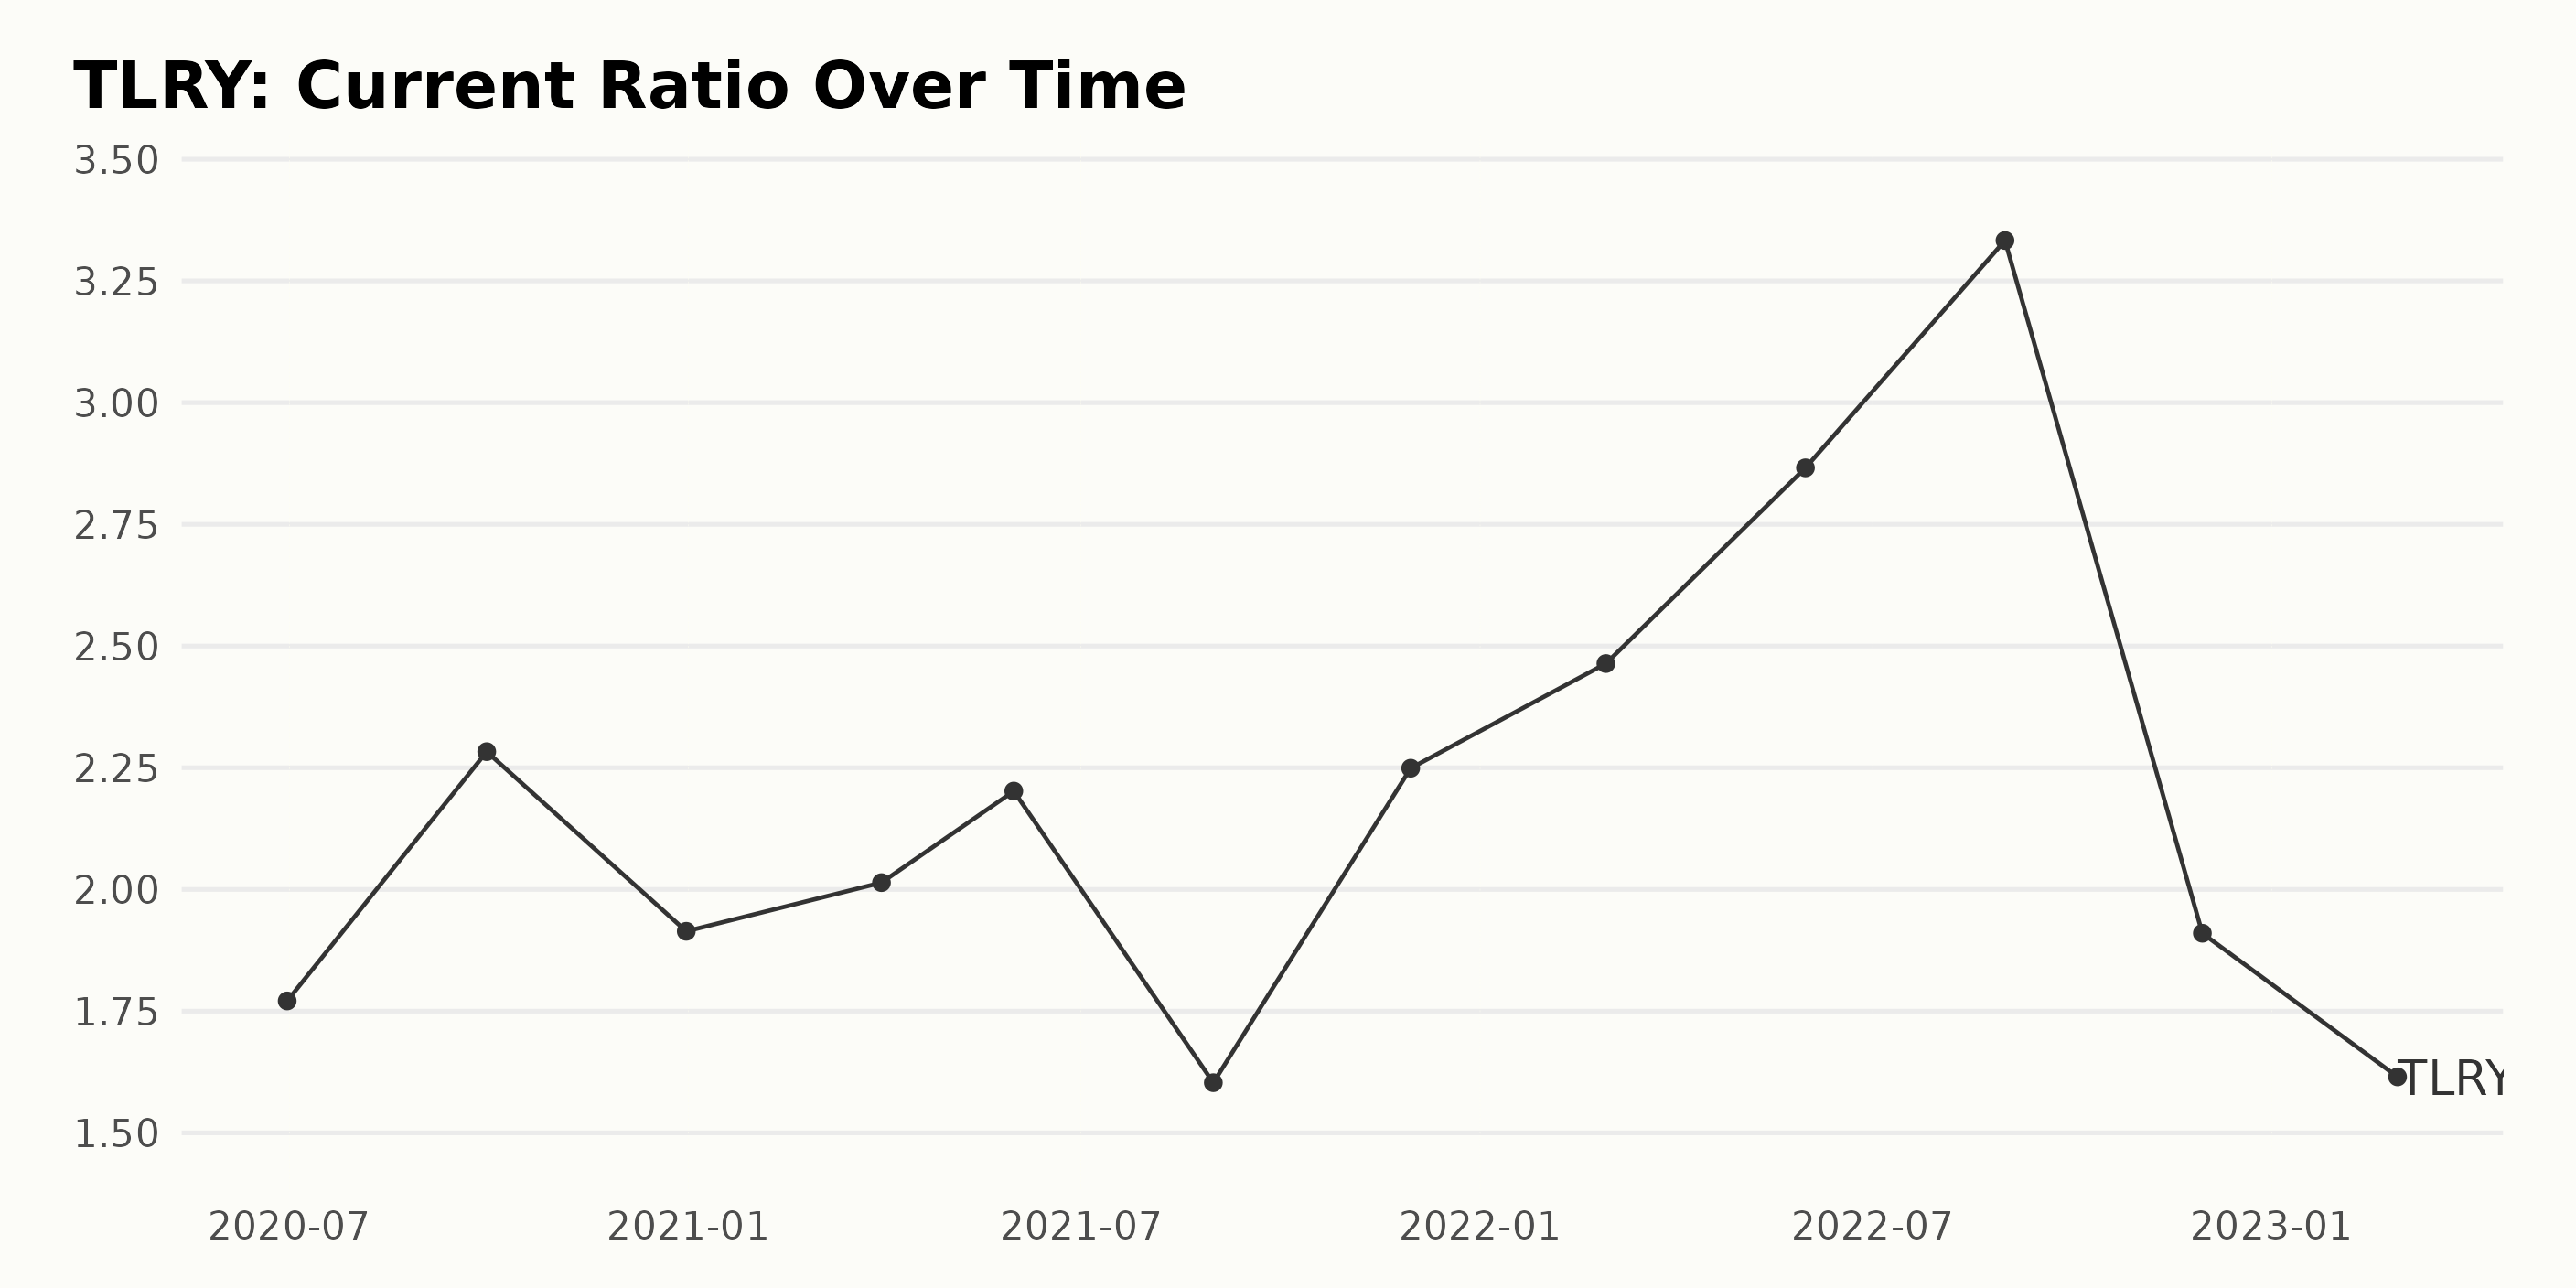
Overall, the current ratio of TLRY has fluctuated between 1.61 and 3.33 over the past two years. It hit its peak of 3.33 in August 2022 and then dropped steadily to its lowest point of 1.61 in February 2023. The most recent value reported was 2.46 in February 2022, representing a growth rate of 41% since June 2020.
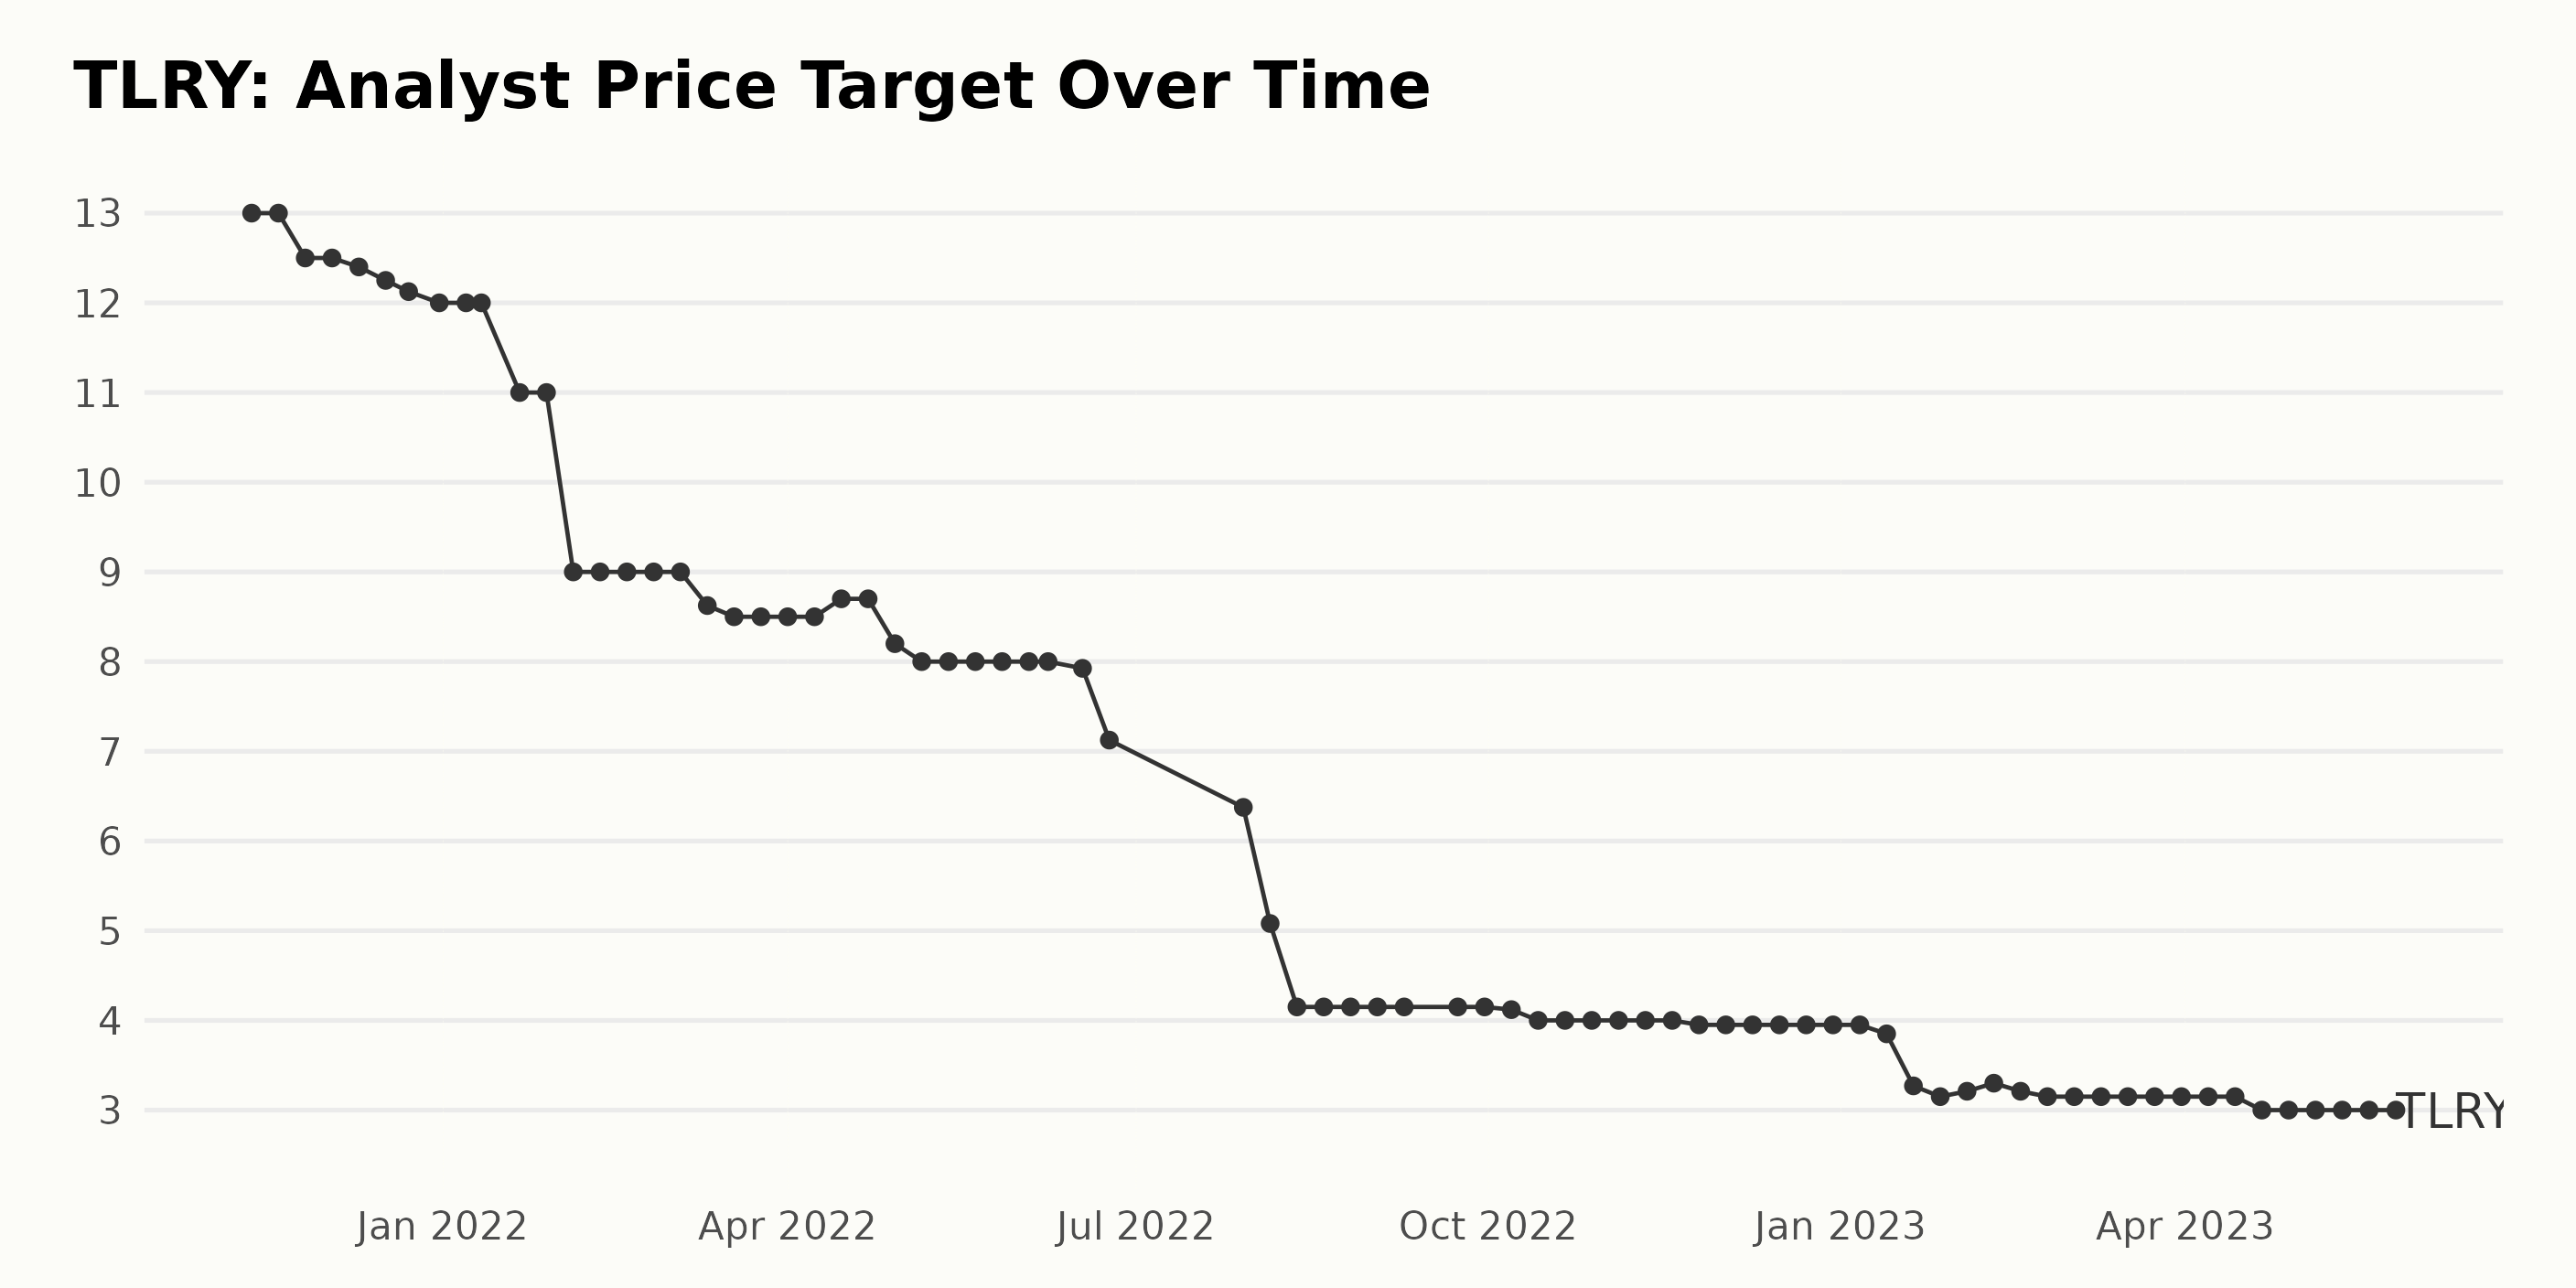
The TLRY analyst price target has experienced fluctuating levels since November 2021. The price target initially peaked at $13 before gradually declining to $12.13 by December 23, 2021. There was a slight recovery to a peak of $12.25 on December 17, 2021, but then dropped again to $12 by December 31, 2021.
From January 2021 to April 2021, the analyst price target stayed at $12, with occasional decreases to $11 in January 2021 and $9 in February 2021. However, there was no major fluctuation during this period.
After April 2021, the analyst price target experienced rapid fluctuations varying between as low as $5.08 in August 2021, $8 in May 2021, and $8.7 in April 2021. As of May 26, 2023, the current analyst price target sits at $3, representing a 77% decrease in value from its initial level of $13.
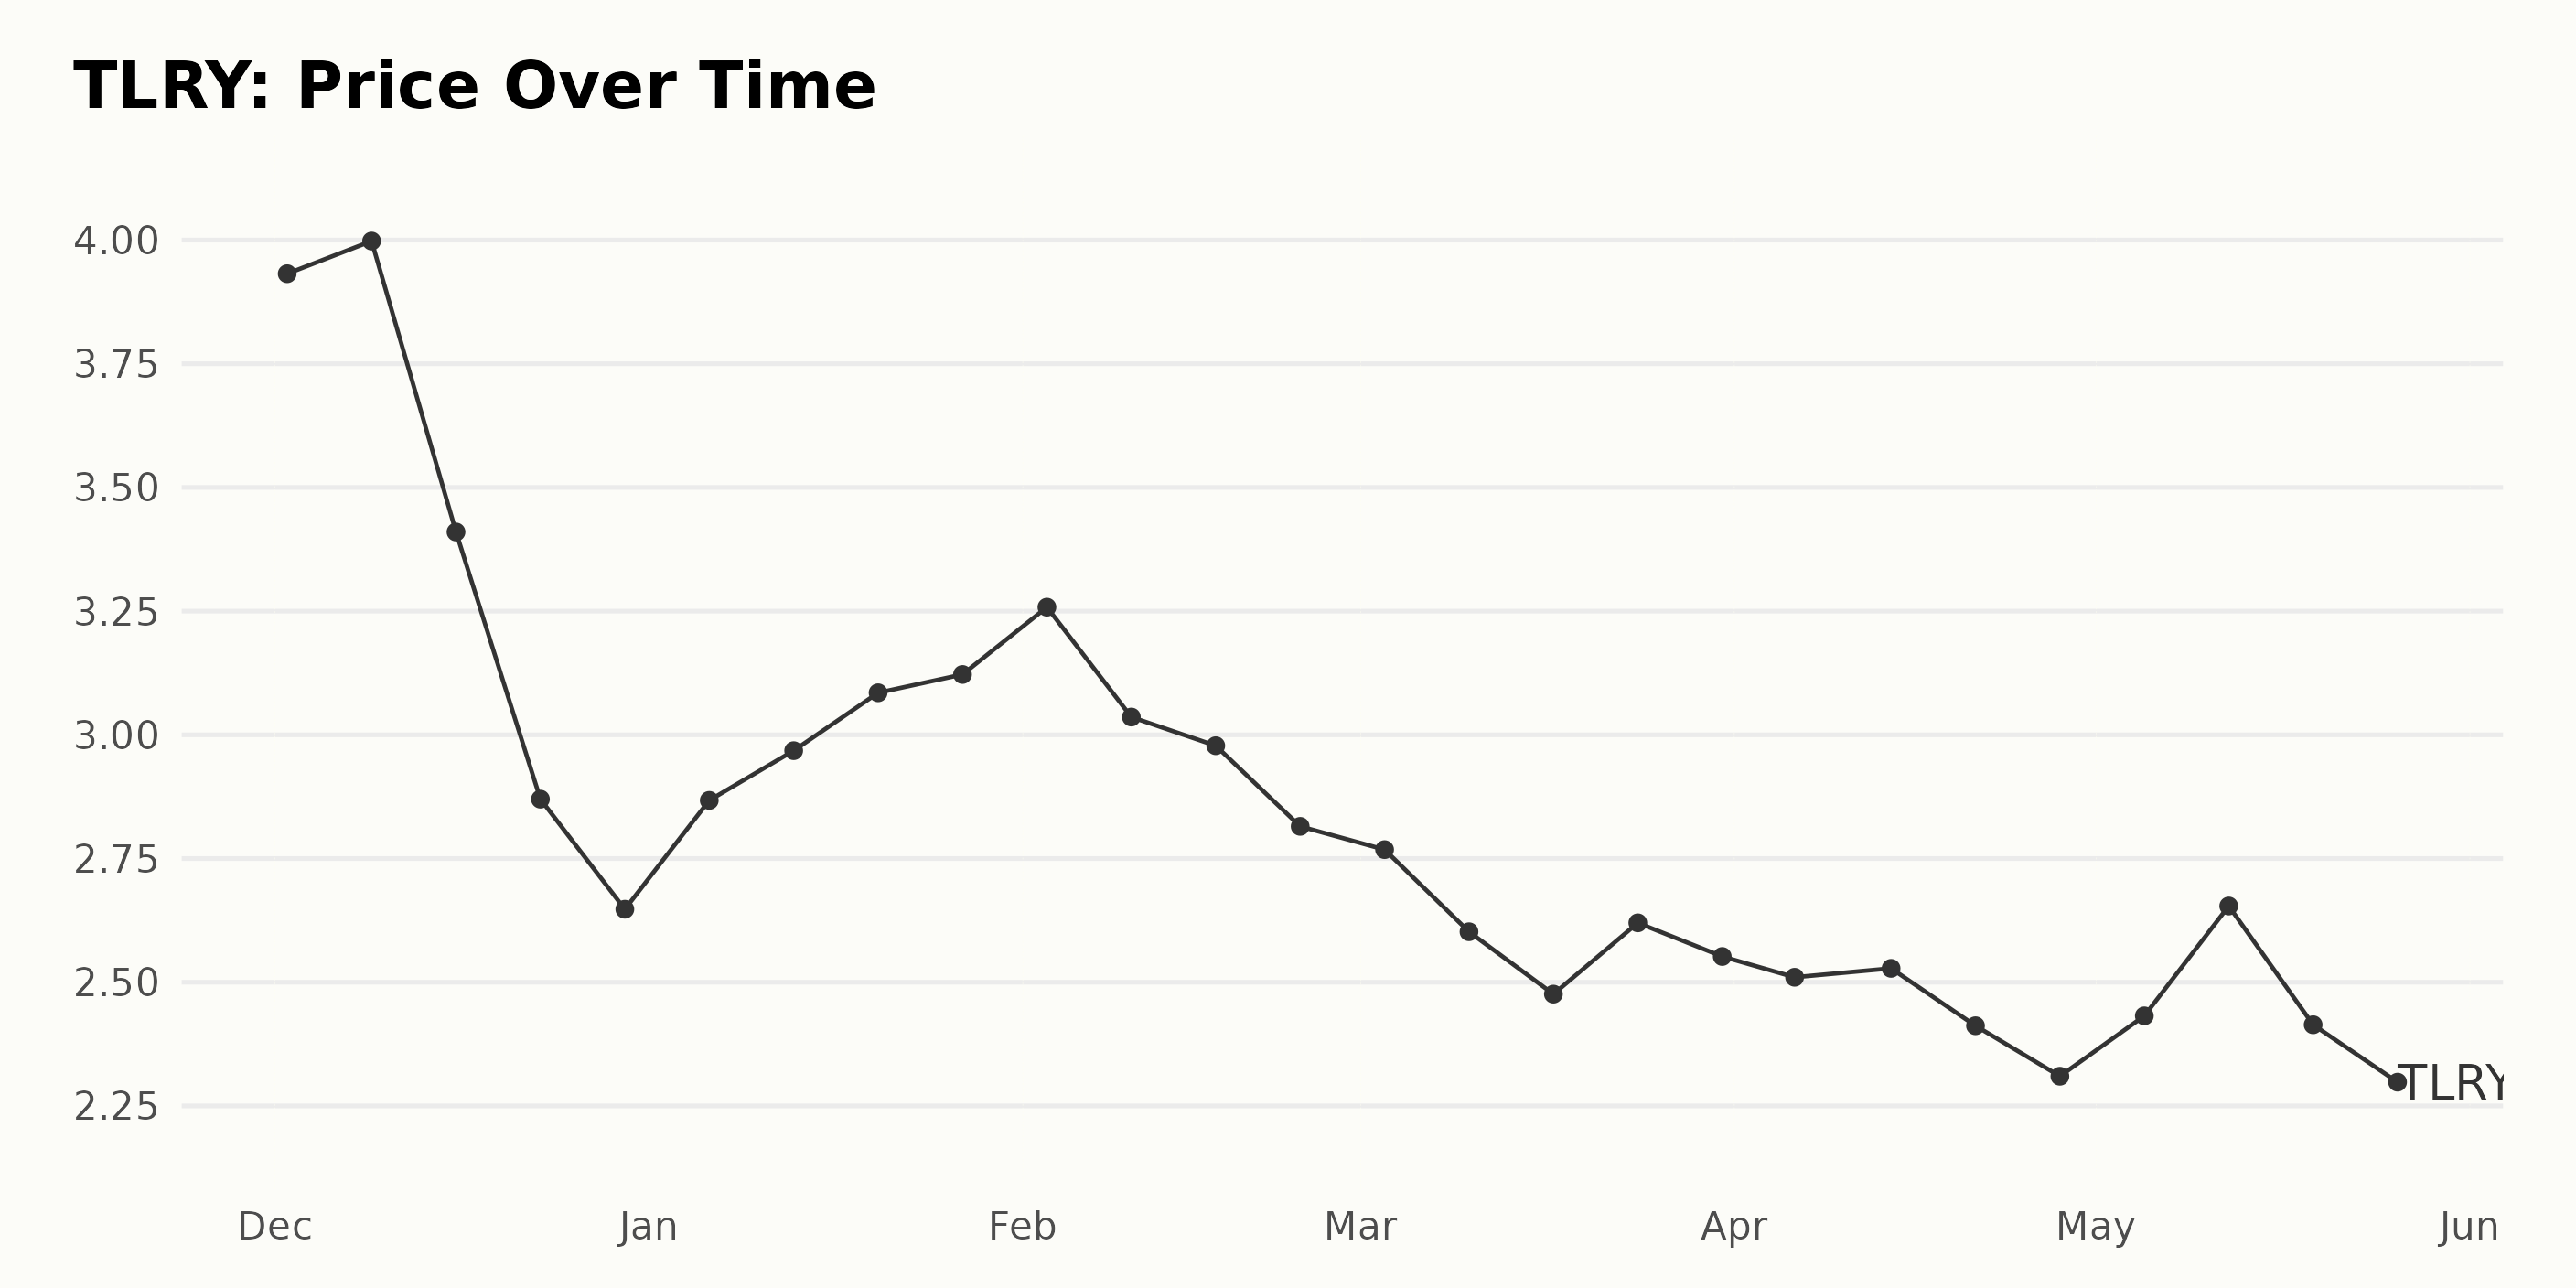
TLRY Share Price Plunges from December 2022 to May 2023
There is a downward trend in the share price of TLRY from December 2022 to May 2023. It started at $3.93 on December 2, 2022, and had a low of $2.31 on April 28, 2023.
However, the share price began to rebound towards the end of the period, ending at $2.36 on May 25, 2023. Over the period, the average growth rate of TLRY was -8.05%. Here is a chart of TLRY's price over the past 180 days.
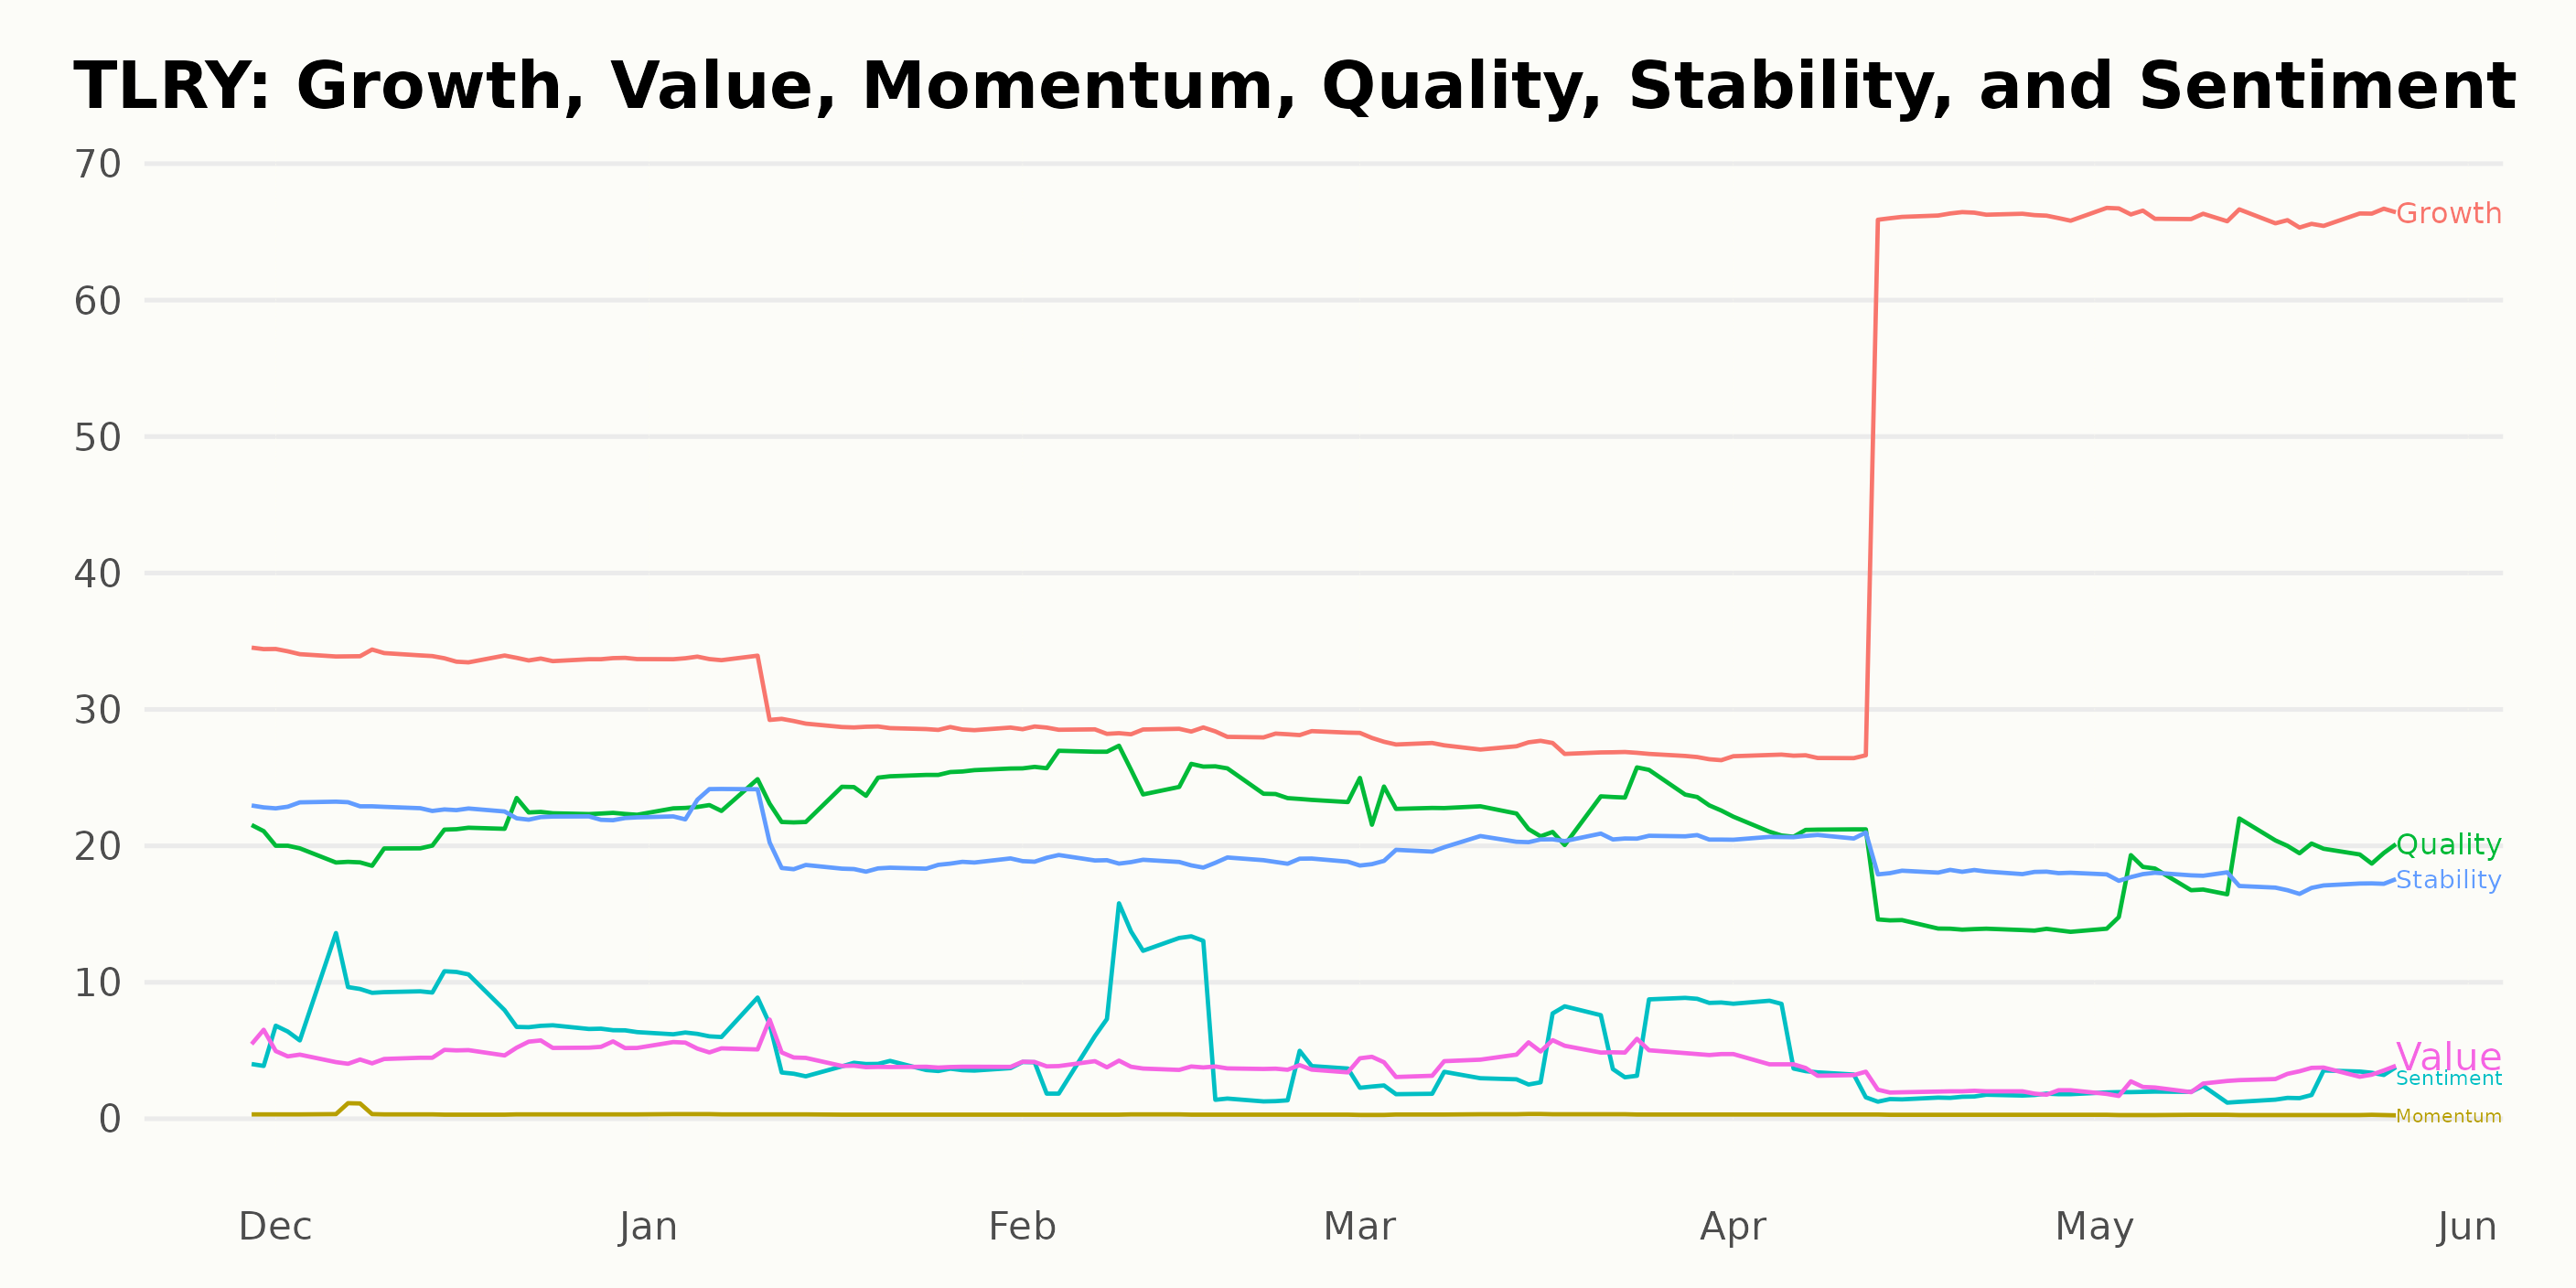
TLRY's POWR Ratings: Growth, Sentiment & Stability
TLRY has consistently received an F grade, which translates to Strong Sell in our proprietary POWR Ratings system over the last four months. The latest rank in the D-rated Medical - Pharmaceuticals industry is #164 out of 169 total stocks.
The most noteworthy POWR Ratings for TLRY are Growth, Sentiment, and Stability. Growth has consistently remained among the highest-rated dimensions, with ratings ranging from a low of 27 to a high of 66 between November 2022 and May 2023.
Sentiment also displays a clearly recognizable trend, trending upwards from its lowest rating of 2 in May 2023 to its highest rating of 8 in December 2022. Stability is less volatile than the other two dimensions, consistently maintaining ratings between 17 and 23.
How does Tilray Brands, Inc. (TLRY) Stack Up Against its Peers?
Other stocks in the Medical - Pharmaceuticals sector that may be worth considering are Novartis AG (NVS), Novo Nordisk A/S (NVO), and AbbVie Inc. (ABBV) -- they have better POWR Ratings.
The Bear Market is NOT Over…
That is why you need to discover this timely presentation with a trading plan and top picks from 40 year investment veteran Steve Reitmeister:
REVISED: 2023 Stock Market Outlook >
TLRY shares were trading at $1.86 per share on Friday afternoon, down $0.50 (-21.19%). Year-to-date, TLRY has declined -30.86%, versus a 10.16% rise in the benchmark S&P 500 index during the same period.
About the Author: Anushka Dutta

Anushka is an analyst whose interest in understanding the impact of broader economic changes on financial markets motivated her to pursue a career in investment research.
The post Should You Add Shares of Tilray Brands (TLRY) to Your Portfolio? appeared first on StockNews.com