Citigroup (NY:C)
Price and Volume
Detailed Quote| Volume | 2,575,053 |
| Open | 123.12 |
| Bid (Size) | 124.63 (300) |
| Ask (Size) | 124.67 (100) |
| Prev. Close | 122.27 |
| Today's Range | 122.44 - 124.88 |
| 52wk Range | 95.83 - 147.96 |
| Shares Outstanding | 2,087,317,952 |
| Dividend Yield | 2.15% |
Top News
More News
Citigroup Announces Full Redemption of Series Y Preferred Stock
November 09, 2026
Performance
52-Week Range
15.8% below 52-week high
124.65
95.8352W Low
147.9652W High
1 Week
2.3% below 1-week high
117.091W Low
127.591W High
Citigroup (C) traded between $95.83 and $147.96 over the past 52 weeks and last traded at $124.65, 15.8% below its 52-week high. Over the past week it ranged between $117.09 and $127.59.
Past 12 Months
1W
-$0.09
1M
-$7.27
3M
-$11.12
6M
-$1.79
YTD
+$5.95
1Y
+$23.16
C was +22.8% over the past year, -1.4% over six months, +5.0% year to date, -0.1% in the last week.
12 Months vs Market
C
+22.8%
DIA
+10.6%
SPY
+11.7%
QQQ
+11.3%
IWM
+16.1%
Over the past 12 months C returned +22.8% versus DIA (Dow) +10.6%, SPY (S&P 500) +11.7%, QQQ (Nasdaq 100) +11.3% and IWM (Russell 2000) +16.1%.
Volume & Liquidity
0.27× 3-mo avg
Today 2,575,053
3-mo avg 9.5M
1W
12.9M
1M
10.4M
3M
9.5M
6M
10.8M
YTD
12.2M
1Y
12.3M
C most recently traded 2,575,053 shares against a 3-month average daily volume of 9.5M.
More News
Read More
Why Meta Platforms Stock Rallied on Monday ↗
November 09, 2026

Citi Downgraded Adobe Stock to Sell. I'd Buy It Now. ↗
November 09, 2026

Here's How These 6 Big Bank Stocks Make Their Money ↗
November 07, 2026
Why Sandisk Stock Bounced Back Friday ↗
November 06, 2026
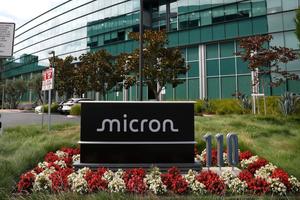
Why Micron Stock Bounced Back Friday ↗
November 06, 2026


Q3 earnings recap: Citigroup (NYSE:C) tops diversified banks stocks
November 05, 2026

Bank Earnings Have Entered the Upside-Down ↗
November 05, 2026

Nebius Stock: The Bull Case, the Bear Case, and My Call Before Nov. 12 ↗
November 05, 2026
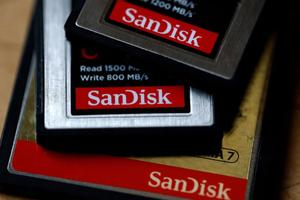
Why Sandisk Stock Sank Today ↗
November 04, 2026


Evercore (EVR) stock trades up, here is why
November 02, 2026

3 Bank Stocks With Buyback Plans of at Least $30 Billion Worth a Look ↗
November 02, 2026


Why GE Vernova Stock Fell on Friday ↗
October 30, 2026


3 large-cap stocks we steer clear of
October 28, 2026


Analysts Turn Bullish on Meta Platforms Despite Post-Earnings Fall ↗
October 27, 2026

Frequently Asked Questions
Is Citigroup publicly traded?
Yes, Citigroup is publicly traded.
What exchange does Citigroup trade on?
Citigroup trades on the New York Stock Exchange
What is the ticker symbol for Citigroup?
The ticker symbol for Citigroup is C on the New York Stock Exchange
What is the current price of Citigroup?
The current price of Citigroup is 124.65
When was Citigroup last traded?
The last trade of Citigroup was at 11/11/26 02:06 PM ET
What is the market capitalization of Citigroup?
The market capitalization of Citigroup is 260.18B
How many shares of Citigroup are outstanding?
Citigroup has 260B shares outstanding.
Stock Quote API & Stock News API supplied by www.cloudquote.io
Quotes delayed at least 20 minutes.
By accessing this page, you agree to the Privacy Policy and Terms Of Service.
Quotes delayed at least 20 minutes.
By accessing this page, you agree to the Privacy Policy and Terms Of Service.
© 2025 FinancialContent. All rights reserved.