Ntt Inc. S/Ads (OP:NTTYY)Price and VolumeDetailed Quote
Top NewsMore NewsPerformance
52-Week Range
12.8% below 52-week high
26.20
21.4752W Low
30.0552W High
1 Week
6.8% below 1-week high
27.071W Low
28.111W High
Ntt Inc. S/Ads (NTTYY) traded between $21.47 and $30.05 over the past 52 weeks and last traded at $26.20, 12.8% below its 52-week high. Over the past week it ranged between $27.07 and $28.11.
Past 12 Months
1W
-$0.90
1M
-$0.71
3M
+$2.40
6M
+$1.97
YTD
+$1.06
1Y
+$0.50
NTTYY was +1.9% over the past year, +8.1% over six months, +4.2% year to date, -3.3% in the last week.
12 Months vs Market
NTTYY
DIA
SPY
QQQ
IWM
Over the past 12 months NTTYY returned +1.9% versus DIA (Dow) +12.4%, SPY (S&P 500) +12.5%, QQQ (Nasdaq 100) +9.5% and IWM (Russell 2000) +15.8%.
Volume & Liquidity
0.17× 3-mo avg
Today 20,355
3-mo avg 121.9K
1W
1M
3M
6M
YTD
1Y
NTTYY most recently traded 20,355 shares against a 3-month average daily volume of 121.9K. More NewsRead More
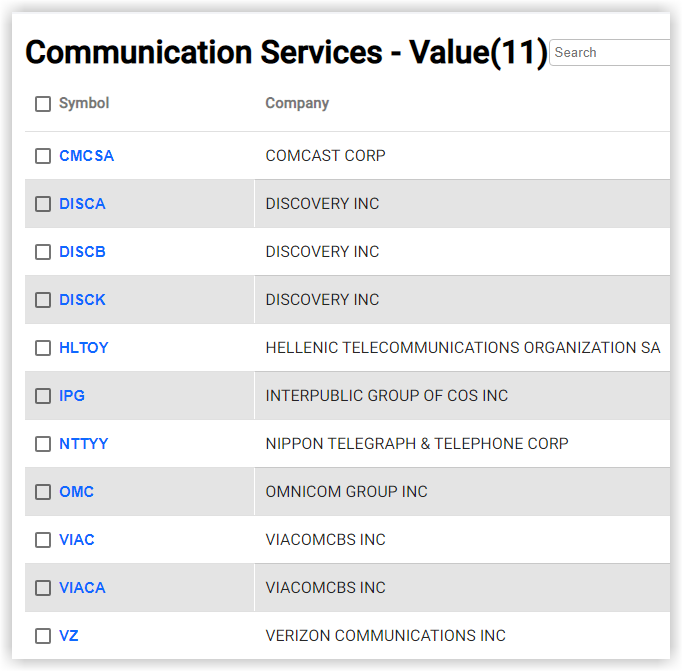
11 Stocks To Buy In The Communication Services Sector ↗
January 07, 2022
Japan Reviews Amazon Web Services Outage: Reuters ↗
September 02, 2021
2 Foreign Telecom Stocks to Buy Now ↗
July 29, 2021
Frequently Asked QuestionsIs Ntt Inc. S/Ads publicly traded?
Yes, Ntt Inc. S/Ads is publicly traded.
What exchange does Ntt Inc. S/Ads trade on?
Ntt Inc. S/Ads trades on the OTC Traded
What is the ticker symbol for Ntt Inc. S/Ads?
The ticker symbol for Ntt Inc. S/Ads is NTTYY on the OTC Traded
What is the current price of Ntt Inc. S/Ads?
The current price of Ntt Inc. S/Ads is 26.20
When was Ntt Inc. S/Ads last traded?
The last trade of Ntt Inc. S/Ads was at 11/04/26 01:00 PM ET
Stock Quote API & Stock News API supplied by www.cloudquote.io
Quotes delayed at least 20 minutes. By accessing this page, you agree to the Privacy Policy and Terms Of Service.
© 2025 FinancialContent. All rights reserved.
|