Auto Insurance Repair Cycle Times Improve but Price Increases Take a Toll, J.D. Power Finds
NJM Insurance Co. Ranks Highest in Customer Satisfaction with Auto Insurance Claims
Auto insurers have been fighting two major headwinds ever since the pandemic: rising costs and longer repair cycle times. This year, according to the J.D. Power 2024 U.S. Auto Claims Satisfaction Study,SM released today, some relief is in sight for one of those trends. The study shows that the average repair cycle time for claims filed later in the fielding period is 18.9 days, which is down 5.0 days from 23.9 days in the early fielding period. While that may offer some relief to insurers and their customers, the cost side of the equation has gone in the opposite direction, with the average repair cost rising 26% in the past two years. Premiums have followed suit, rising 15% during the past year.
This press release features multimedia. View the full release here: https://www.businesswire.com/news/home/20241029377124/en/
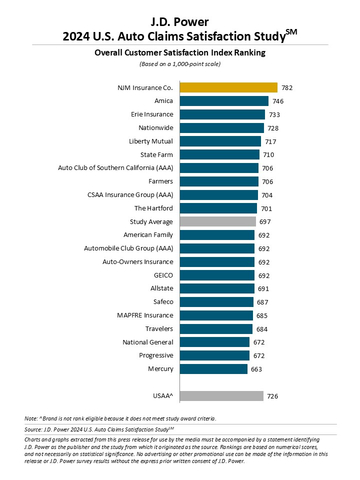
J.D. Power 2024 U.S. Auto Claims Satisfaction Study (Graphic: Business Wire)
“The claims process is the moment of truth for auto insurance customers, so when they experience rate increases and then have a claim with longer-than-expected repair times and other inconveniences, their overall trust in the brand is greatly diminished,” said Mark Garrett, director of global insurance intelligence at J.D. Power. “In fact, 80% of auto insurance customers who have poor claims experiences have already left or say they plan to leave that carrier. That makes this year’s significant improvement in repair cycle times very good news for insurers and their customers. However, premium increases have created a new challenge for insurers as trust is eroding and affecting the way customers view their claims. There are still many challenges the industry needs to navigate to maintain customer loyalty.”
Following are some key findings of the 2024 study:
- Relief for repair cycle times: The overall average repair cycle time in this year’s study is 22.3 days, down 1.0 day from the 2023 study. However, when results are broken out into the quarter in which the claim was filed, cycle times have improved steadily since peaking in early 2023, for a total 5.0-day reduction throughout fielding of the 2024 study.
- Premium increases following claims crush customer satisfaction: Overall, 48% of study respondents experienced a premium increase during the past 12 months. Satisfaction is particularly low among those who incurred increases prior to their claim, and these customers may have been entering the claim process already upset by rising prices. The study shows that these customers were more likely to have an issue—such as communication with the insurer not being very easy or timing expectations not being managed—and thus they didn’t feel more at ease after submitting their claim. Furthermore, nearly half of those increases were attributable to claims. Compared with those customers who did not have an increase, satisfaction scores fall more than 100 points (on a 1,000-point scale) following a claim-related rate increase. This negative effect is most pronounced among Boomers1 and Pre-Boomers, with a 178-point decrease in trust following a claim-related rate increase.
- Digital claims processing drives satisfaction but not for all customers: Insurers have been focused on improving mobile apps and the outcome appears to be paying off. For the past three years, claims filed via call centers or agents outperformed digital channels, but now digital is receiving higher scores with mobile apps achieving the highest scores. In addition, satisfaction is higher among those who stay in the app to submit photos and receive status updates (775) than for all other digital experiences. However, this group comprises only 13% of customers. Boomers and Pre-Boomers are still hesitant to adopt fully digital processes, with 32% stating they disagree with being comfortable using digital tools for the entire claim. Customers also rate digital channels lower than speaking with someone if they have a specific question. Thus, generational differences and the types of tasks being performed are still affecting digital experiences.
- Good communication is key to satisfying claim experience: The No. 1 key performance indicator in the study is to ensure that communicating with insurer reps is very easy. Being accessible; responding in a timely fashion; reps providing consistent service; managing timing expectations; and providing options for proactive updates are all critical elements of communication throughout a claim. This is another area in which digital tools play a key role in customers’ ability to access information and stay informed.
Study Ranking
NJM Insurance Co. ranks highest in overall customer satisfaction with a score of 782. Amica (746) ranks second and Erie Insurance (733) ranks third.
The U.S. Auto Claims Satisfaction Study was redesigned for 2024. Scores are not comparable year over year with previous studies. The 2024 study is based on responses from 9,725 auto insurance customers who settled a claim within the past nine months prior to participating in the survey. It measures customer experience across eight core dimensions (in order of importance): trust; fairness of settlement; time to settle claim; people; communication; ease of resolving claim; ease of starting claim; and digital channels. The study excludes claimants whose vehicle incurred only glass/windshield damage or was stolen, or who only filed a roadside assistance claim. The study was fielded from October 2023 through August 2024.
For more information about the U.S. Auto Claims Satisfaction Study, visit
https://www.jdpower.com/resource/jd-power-us-auto-claims-satisfaction-study.
See the online press release at http://www.jdpower.com/pr-id/2024133.
About J.D. Power
J.D. Power is a global leader in consumer insights, advisory services, and data and analytics. A pioneer in the use of big data, artificial intelligence (AI) and algorithmic modeling capabilities to understand consumer behavior, J.D. Power has been delivering incisive industry intelligence on customer interactions with brands and products for more than 55 years. The world's leading businesses across major industries rely on J.D. Power to guide their customer-facing strategies.
J.D. Power has offices in North America, Europe and Asia Pacific. To learn more about the company's business offerings, visit JDPower.com/business. The J.D. Power auto-shopping tool can be found at JDPower.com.
About J.D. Power and Advertising/Promotional Rules: www.jdpower.com/business/about-us/press-release-info
1 J.D. Power defines generational groups as Pre-Boomers (born before 1946); Boomers (1946-1964); Gen X (1965-1976); Gen Y (1977-1994); and Gen Z (1995-2006). Millennials (1982-1994) are a subset of Gen Y.
View source version on businesswire.com: https://www.businesswire.com/news/home/20241029377124/en/
Contacts
Media Relations Contacts
Geno Effler, J.D. Power; West Coast; 714-621-6224; media.relations@jdpa.com
John Roderick; East Coast; 631-584-2200; john@jroderick.com
More News
View More


Recent Quotes
View More
Quotes delayed at least 20 minutes.
By accessing this page, you agree to the Privacy Policy and Terms Of Service.