Jack in the Box (NASDAQ:JACK) Reports Sales Below Analyst Estimates In Q3 Earnings, Stock Drops

Fast-food chain Jack in the Box (NASDAQ: JACK) missed Wall Street’s revenue expectations in Q3 CY2024, with sales falling 6.2% year on year to $349.3 million. Its GAAP profit of $1.12 per share was 1.1% below analysts’ consensus estimates.
Is now the time to buy Jack in the Box? Find out by accessing our full research report, it’s free.
Jack in the Box (JACK) Q3 CY2024 Highlights:
- Revenue: $349.3 million vs analyst estimates of $356.7 million (6.2% year-on-year decline, 2.1% miss)
- Adjusted EPS: $1.12 vs analyst expectations of $1.13 (1.1% miss)
- Adjusted EBITDA: $65.51 million vs analyst estimates of $65.24 million (18.8% margin, in line)
- EPS (GAAP) guidance for the upcoming financial year 2025 is $5.25 at the midpoint, missing analyst estimates by 18.1%
- EBITDA guidance for the upcoming financial year 2025 is $295.5 million at the midpoint, below analyst estimates of $312.8 million
- Operating Margin: 14.6%, in line with the same quarter last year
- Locations: 2,191 at quarter end, down from 2,778 in the same quarter last year
- Same-Store Sales fell 2.1% year on year (2.9% in the same quarter last year)
- Market Capitalization: $880.4 million
“I am very pleased we achieved our gross opening targets for both Jack in the Box and Del Taco in fiscal 2024, reflecting a level of growth not seen in over a decade, and also with the significant progress on our digital initiatives and POS rollout,” said Darin Harris, Jack in the Box Chief Executive Officer.
Company Overview
Delighting customers since its inception in 1951, Jack in the Box (NASDAQ: JACK) is a distinctive fast-food chain known for its bold flavors, innovative menu items, and quirky marketing.
Traditional Fast Food
Traditional fast-food restaurants are renowned for their speed and convenience, boasting menus filled with familiar and budget-friendly items. Their reputations for on-the-go consumption make them favored destinations for individuals and families needing a quick meal. This class of restaurants, however, is fighting the perception that their meals are unhealthy and made with inferior ingredients, a battle that's especially relevant today given the consumers increasing focus on health and wellness.
Sales Growth
A company’s long-term sales performance can indicate its overall quality. Any business can put up a good quarter or two, but many enduring ones grow for years.
Jack in the Box is a mid-sized restaurant chain, which sometimes brings disadvantages compared to larger competitors benefiting from better brand awareness and economies of scale. On the other hand, it has an edge over smaller competitors with fewer resources and can still flex high growth rates because it’s working from a smaller revenue base.
As you can see below, Jack in the Box grew its sales at a solid 10.6% compounded annual growth rate over the last five years (we compare to 2019 to normalize for COVID-19 impacts) despite closing restaurants, implying that growth was driven by higher sales at existing, established dining locations.
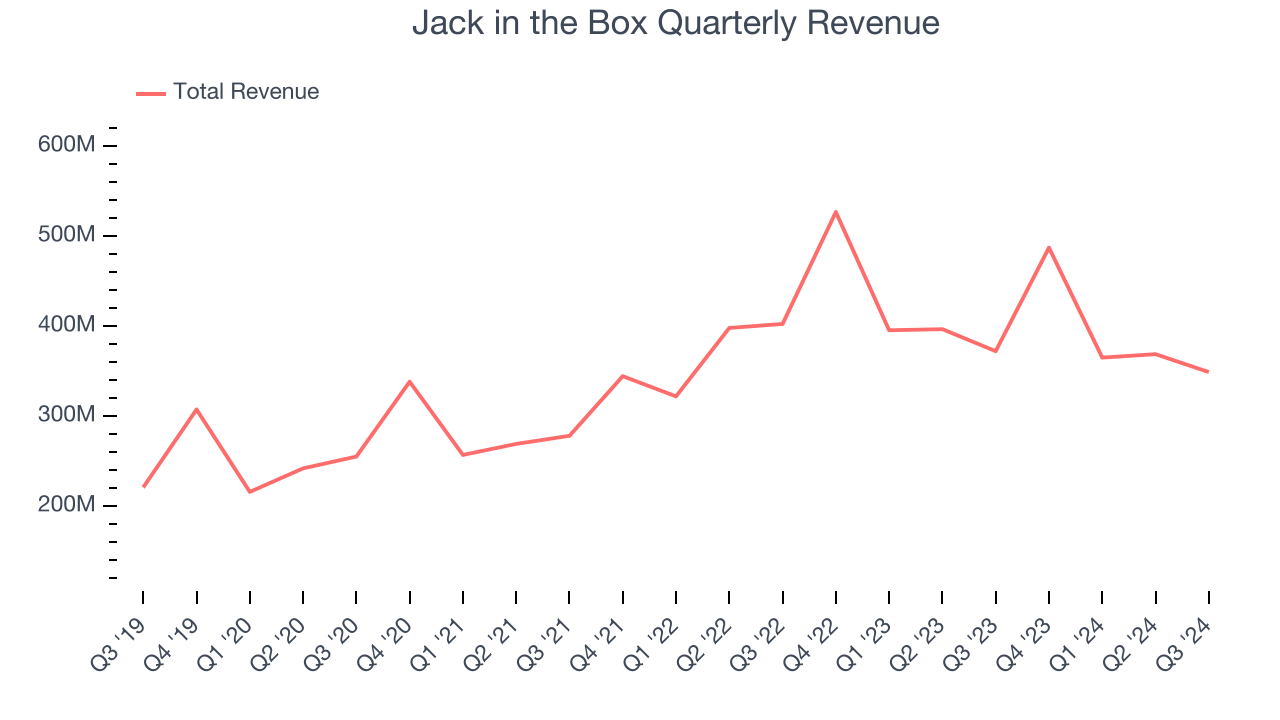
This quarter, Jack in the Box missed Wall Street’s estimates and reported a rather uninspiring 6.2% year-on-year revenue decline, generating $349.3 million of revenue.
Looking ahead, sell-side analysts expect revenue to decline 2.4% over the next 12 months, a deceleration versus the last five years. This projection doesn't excite us and implies its offerings will face some demand challenges.
Today’s young investors won’t have read the timeless lessons in Gorilla Game: Picking Winners In High Technology because it was written more than 20 years ago when Microsoft and Apple were first establishing their supremacy. But if we apply the same principles, then enterprise software stocks leveraging their own generative AI capabilities may well be the Gorillas of the future. So, in that spirit, we are excited to present our Special Free Report on a profitable, fast-growing enterprise software stock that is already riding the automation wave and looking to catch the generative AI next.
Restaurant Performance
Number of Restaurants
A restaurant chain’s total number of dining locations influences how much it can sell and how quickly revenue can grow.
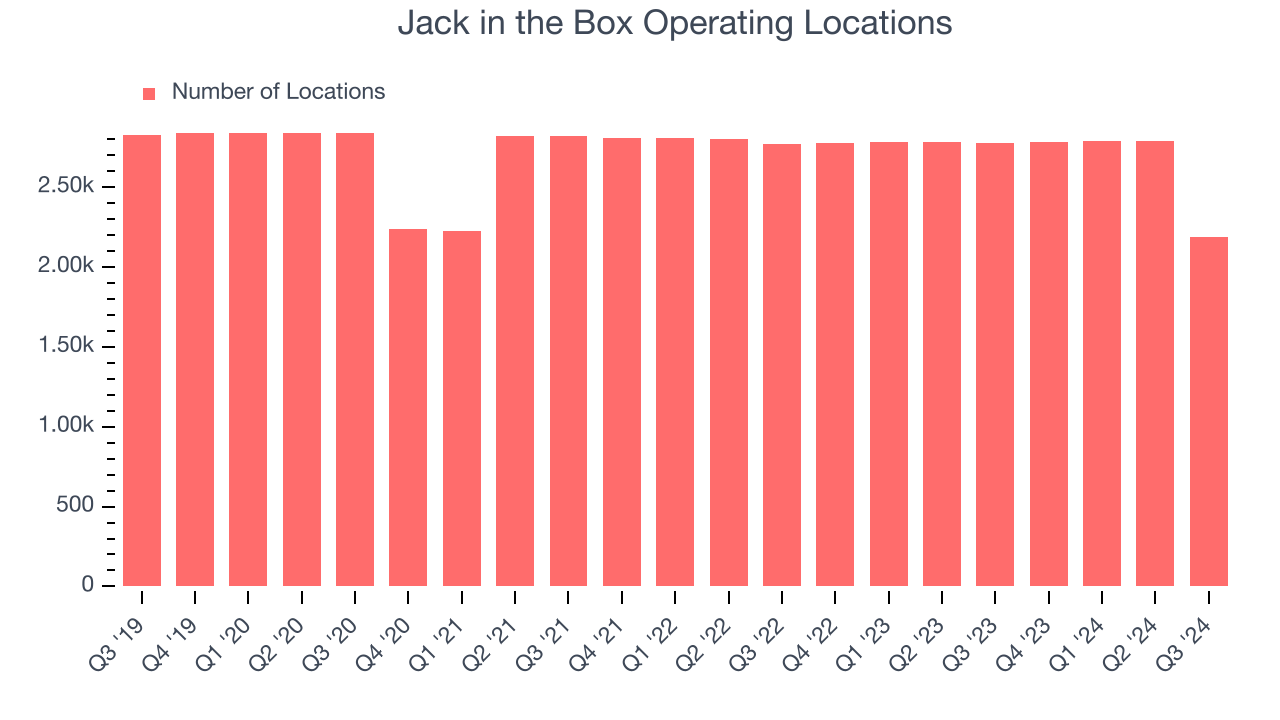
Jack in the Box listed 2,191 locations in the latest quarter and has generally closed its restaurants over the last two years, averaging 2.8% annual declines.
When a chain shutters restaurants, it usually means demand for its meals is waning, and it is responding by closing underperforming locations to improve profitability.
Same-Store Sales
A company's restaurant base only paints one part of the picture. When demand is high, it makes sense to open more. But when demand is low, it’s prudent to close some locations and use the money in other ways. Same-store sales gives us insight into this topic because it measures organic growth at restaurants open for at least a year.
Jack in the Box’s demand rose over the last two years and slightly outpaced the industry. On average, the company’s same-store sales have grown by 2.4% per year. Given its declining restaurant base over the same period, this performance stems from a mixture of higher prices and increased foot traffic at existing locations (closing restaurants can sometimes boost same-store sales).
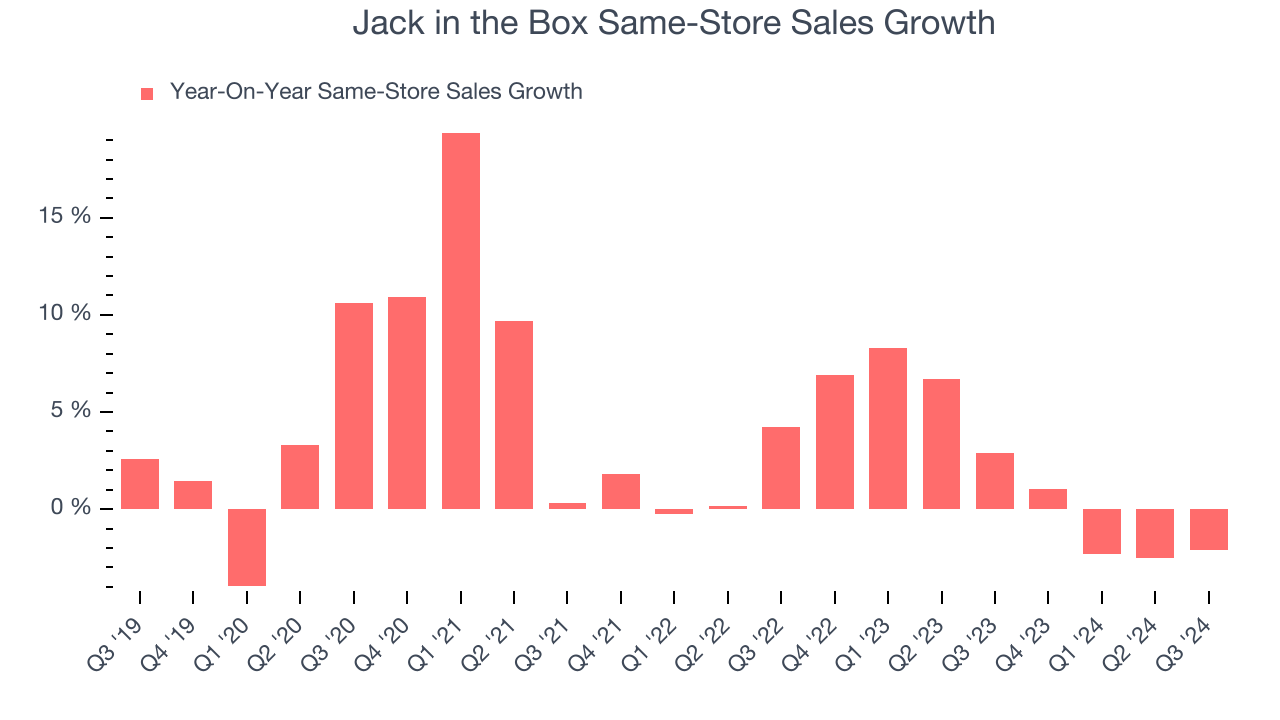
In the latest quarter, Jack in the Box’s same-store sales fell by 2.1% year on year. This decline was a reversal from its historical levels.
Key Takeaways from Jack in the Box’s Q3 Results
We struggled to find many resounding positives in these results. Its full-year EPS guidance missed significantly and its revenue fell short of Wall Street’s estimates due to weak same-store sales growth. Overall, this was a softer quarter. The stock traded down 5.6% to $43.05 immediately after reporting.
Jack in the Box may have had a tough quarter, but does that actually create an opportunity to invest right now? We think that the latest quarter is only one piece of the longer-term business quality puzzle. Quality, when combined with valuation, can help determine if the stock is a buy. We cover that in our actionable full research report which you can read here, it’s free.
More News
View More


Recent Quotes
View More
Quotes delayed at least 20 minutes.
By accessing this page, you agree to the Privacy Policy and Terms Of Service.