FB Financial (NYSE:FBK) Delivers Impressive Q3

Regional banking company FB Financial (NYSE: FBK) beat Wall Street’s revenue expectations in Q3 CY2025, with sales up 94.2% year on year to $173.9 million. Its non-GAAP profit of $1.07 per share was 11.5% above analysts’ consensus estimates.
Is now the time to buy FB Financial? Find out by accessing our full research report, it’s free for active Edge members.
FB Financial (FBK) Q3 CY2025 Highlights:
- Net Interest Income: $147.2 million vs analyst estimates of $139.3 million (38.9% year-on-year growth, 5.7% beat)
- Net Interest Margin: 4% vs analyst estimates of 3.8% (19.9 basis point beat)
- Revenue: $173.9 million vs analyst estimates of $166.9 million (94.2% year-on-year growth, 4.2% beat)
- Efficiency Ratio: 53.3% vs analyst estimates of 55.4% (210 basis point beat)
- Adjusted EPS: $1.07 vs analyst estimates of $0.96 (11.5% beat)
- Tangible Book Value per Share: $29.83 vs analyst estimates of $29.58 (6% year-on-year growth, 0.9% beat)
- Market Capitalization: $3.03 billion
President and Chief Executive Officer, Christopher T. Holmes stated, “The Company has aggressive goals in both growth and profitability, and when we assess the year-to-date, I’m proud to say we've delivered. We’ve taken deliberate steps to align and optimize both sides of the balance sheet, establishing a strong foundation for future growth and driving a healthy margin. Additionally, the successful close and conversion of our combination with Southern States marks a significant milestone for our Company. Our team remains focused on disciplined capital management and investing in our future, all with the goal of delivering top-tier returns. As we look ahead to the fourth quarter, we see continuing opportunity to build on this momentum and further elevate the value we provide to our customers and shareholders.”
Company Overview
Founded in 1906 and operating through more than a century of economic cycles, FB Financial (NYSE: FBK) operates FirstBank, providing commercial and consumer banking services across Tennessee, Kentucky, Alabama, and North Georgia.
Sales Growth
Two primary revenue streams drive bank earnings. While net interest income, which is earned by charging higher rates on loans than paid on deposits, forms the foundation, fee-based services across banking, credit, wealth management, and trading operations provide additional income. Unfortunately, FB Financial struggled to consistently increase demand as its $511.8 million of revenue for the trailing 12 months was close to its revenue five years ago. This wasn’t a great result, but there are still things to like about FB Financial.
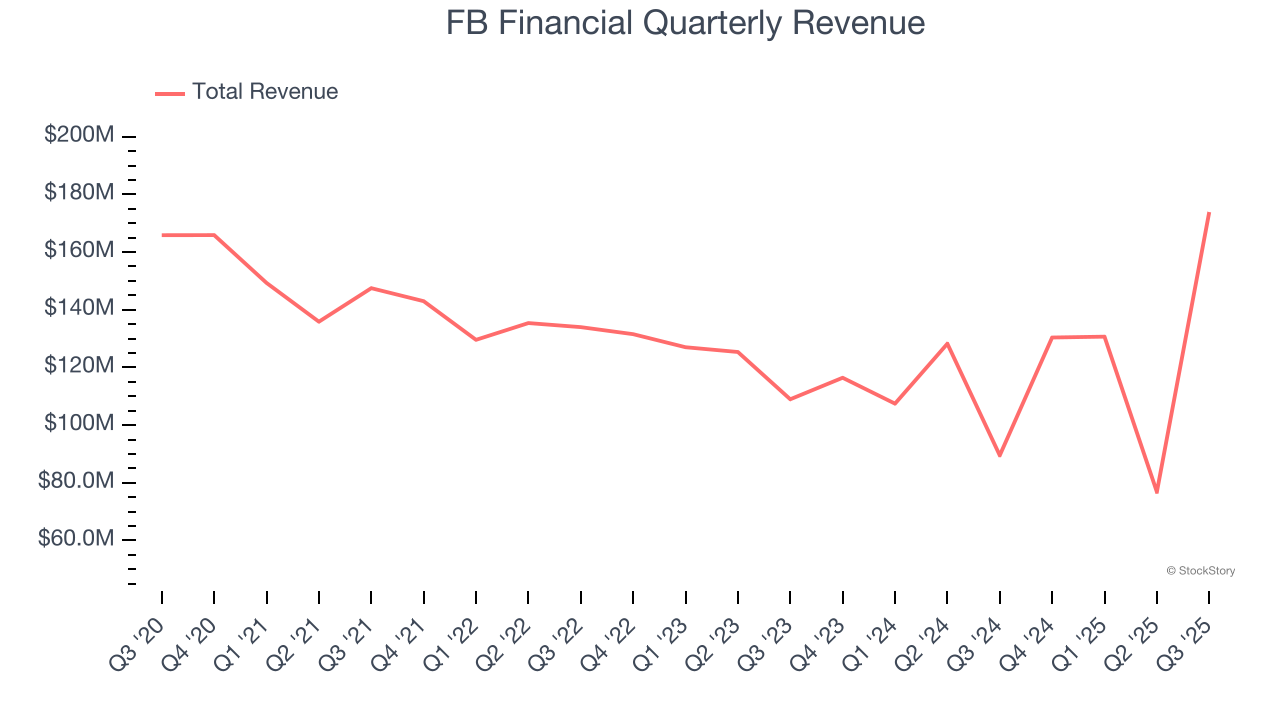
We at StockStory place the most emphasis on long-term growth, but within financials, a half-decade historical view may miss recent interest rate changes, market returns, and industry trends. FB Financial’s annualized revenue growth of 1.9% over the last two years is above its five-year trend, but we were still disappointed by the results. 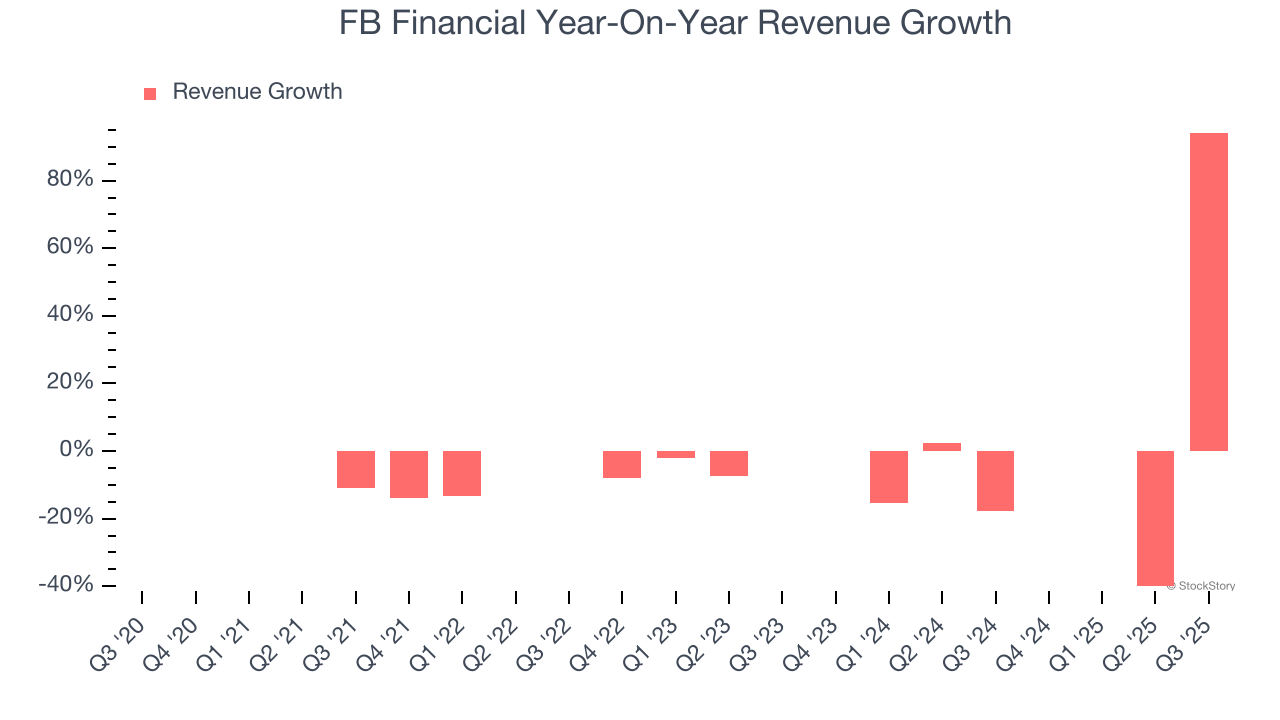 Note: Quarters not shown were determined to be outliers, impacted by outsized investment gains/losses that are not indicative of the recurring fundamentals of the business.
This quarter, FB Financial reported magnificent year-on-year revenue growth of 94.2%, and its $173.9 million of revenue beat Wall Street’s estimates by 4.2%.
Net interest income made up 81.6% of the company’s total revenue during the last five years, meaning FB Financial barely relies on non-interest income to drive its overall growth.
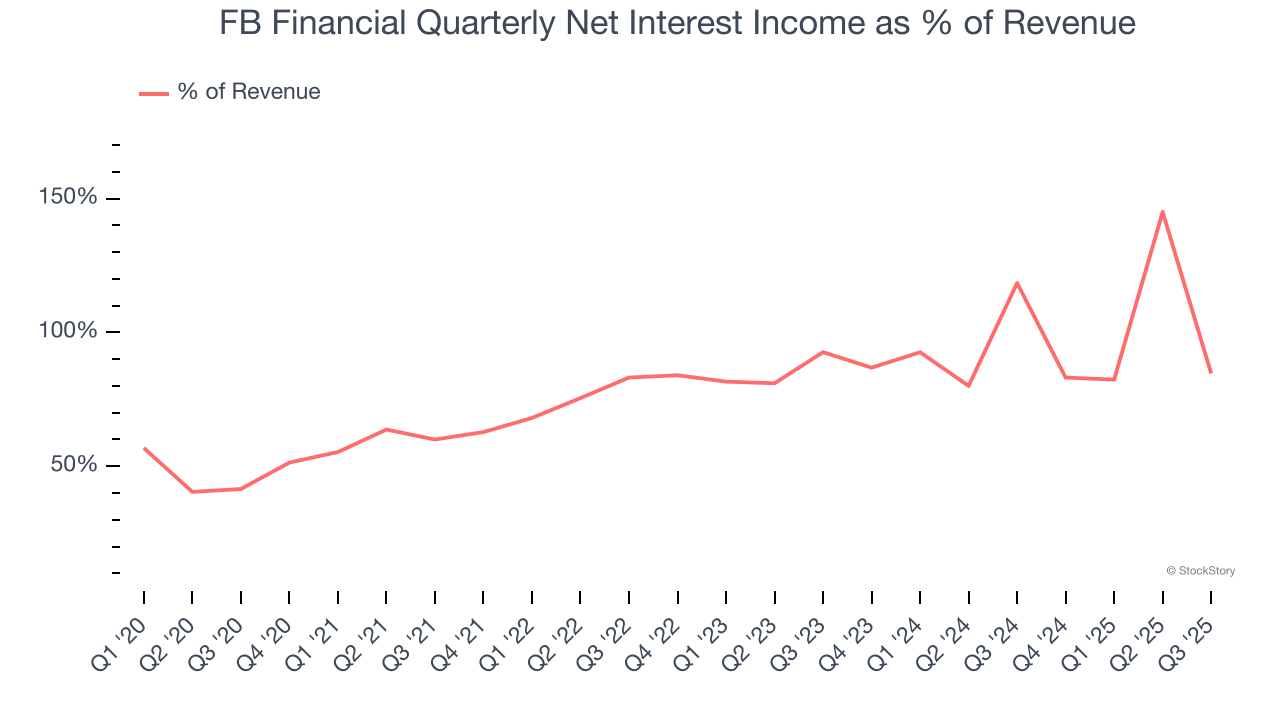
While banks generate revenue from multiple sources, investors view net interest income as the cornerstone - its predictable, recurring characteristics stand in sharp contrast to the volatility of non-interest income.
Software is eating the world and there is virtually no industry left that has been untouched by it. That drives increasing demand for tools helping software developers do their jobs, whether it be monitoring critical cloud infrastructure, integrating audio and video functionality, or ensuring smooth content streaming. Click here to access a free report on our 3 favorite stocks to play this generational megatrend.
Tangible Book Value Per Share (TBVPS)
The balance sheet drives banking profitability since earnings flow from the spread between borrowing and lending rates. As such, valuations for these companies concentrate on capital strength and sustainable equity accumulation potential.
Because of this, tangible book value per share (TBVPS) emerges as the critical performance benchmark. By excluding intangible assets with uncertain liquidation values, this metric captures real, liquid net worth per share. EPS can become murky due to acquisition impacts or accounting flexibility around loan provisions, and TBVPS resists financial engineering manipulation.
FB Financial’s TBVPS grew at an impressive 7.4% annual clip over the last five years. TBVPS growth has also accelerated recently, growing by 11.7% annually over the last two years from $23.93 to $29.83 per share.
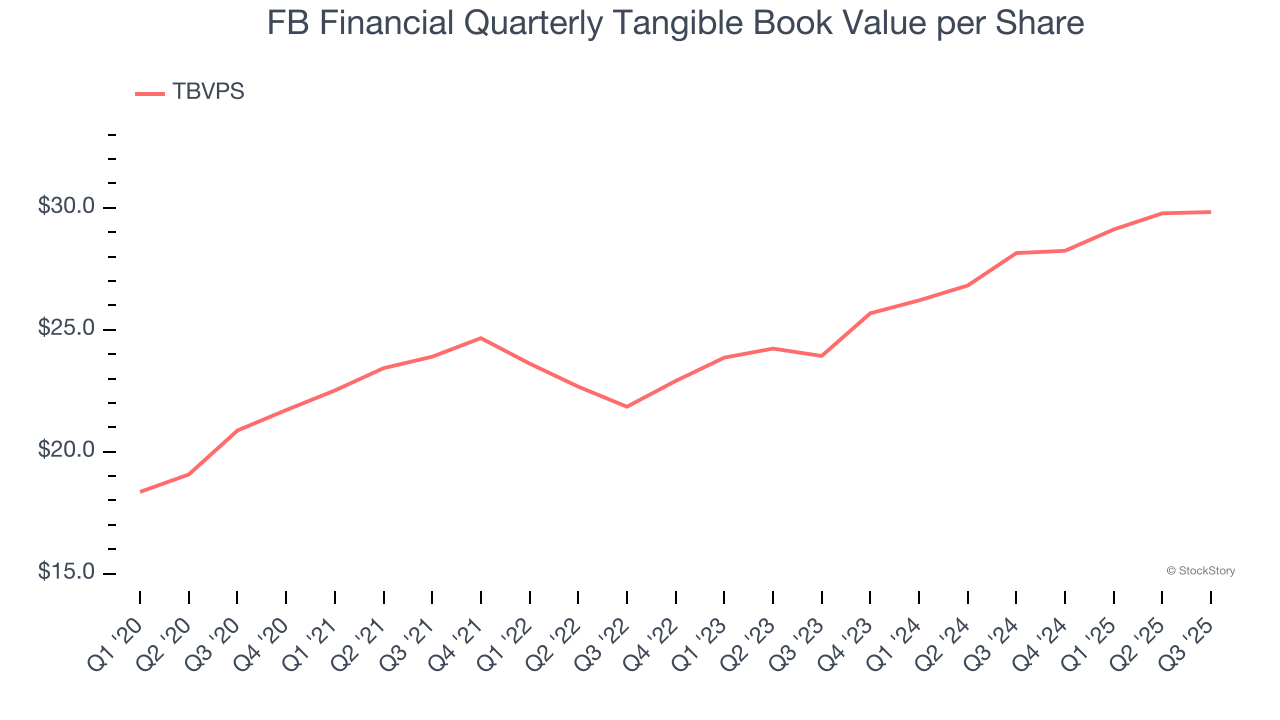
Over the next 12 months, Consensus estimates call for FB Financial’s TBVPS to grow by 12.1% to $33.45, top-notch growth rate.
Key Takeaways from FB Financial’s Q3 Results
We were impressed by how significantly FB Financial blew past analysts’ net interest income expectations this quarter. We were also glad its revenue outperformed Wall Street’s estimates. Zooming out, we think this was a good print with some key areas of upside. The stock traded up 2.9% to $58 immediately following the results.
Indeed, FB Financial had a rock-solid quarterly earnings result, but is this stock a good investment here? When making that decision, it’s important to consider its valuation, business qualities, as well as what has happened in the latest quarter. We cover that in our actionable full research report which you can read here, it’s free for active Edge members.
More News
View More


Recent Quotes
View More
Quotes delayed at least 20 minutes.
By accessing this page, you agree to the Privacy Policy and Terms Of Service.