- Revenue grows 64% Year Over Year
- Professional Certificates momentum drives registered learners to 82 million
Coursera (NYSE: COUR) today announced financial results for its first quarter of fiscal 2021, ended March 31, 2021.
This press release features multimedia. View the full release here: https://www.businesswire.com/news/home/20210504006267/en/
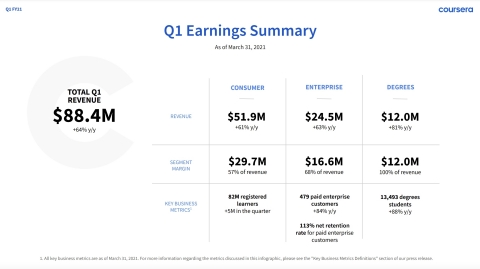
Coursera Q1 FY21 Earnings Infographic (Graphic: Coursera)
“The COVID-19 pandemic has dramatically changed the way we learn, teach, and work. Our strong first-quarter performance reflects the continued trend of individuals and institutions embracing online learning to develop skills for a digital future,” said Coursera CEO Jeff Maggioncalda. “We believe the digital transformation of higher education is only in the early innings, and we see many opportunities to drive growth for Coursera in the years ahead.”
Financial Highlights for First Quarter Fiscal 2021
- Total revenue was $88.4 million, up 64% from $53.8 million a year ago.
- Gross profit was $49.5 million or 56.1% of revenue, up 71% from $28.9 million a year ago. Non-GAAP gross profit was $49.6 million or 56.2% of revenue, up 71% from $29.0 million a year ago.
- Net loss was $(18.7) million or (21.1)% of revenue, compared to $(14.3) million or (26.6)% of revenue a year ago. Non-GAAP net loss was $(13.4) million or (15.1)% of revenue, compared to $(11.3) million or (21.0)% of revenue a year ago.
- Adjusted EBITDA was $(10.1) million or (11.5)% of revenue, compared to $(9.9) million or (18.4)% of revenue a year ago.
- Net cash used in operating activities was $(4.3) million, compared to $(7.5) million a year ago. Free cash flow was $(8.6) million, compared to $(9.9) million a year ago.
For more information regarding the non-GAAP financial measures discussed in this press release, please see "Non-GAAP Financial Measures" and "Reconciliation of GAAP to Non-GAAP Financial Measures" below.
“During the first quarter, we demonstrated our ability to scale all parts of our business with revenue growth of 64% year-on-year,” said Ken Hahn, Coursera’s CFO. “Our freemium model allows us to acquire learners at a low cost and meet their lifelong learning needs with a growing selection of premium, job-relevant content and credentials.”
Operating Segment Highlights
- Consumer revenue for the first quarter was $51.9 million, up 61% from a year ago on broad-based strength across all regions and strong adoption of recently launched Professional Certificates. Segment gross margin was $29.7 million, or 57% of Consumer revenue, compared to 54% a year ago. The company added 5 million new registered learners during the quarter for a total of 82 million.
- Enterprise revenue for the first quarter was $24.5 million, up 63% from a year ago. Paid Enterprise Customers increased 84% from a year ago to 479 as businesses, governments, and campuses deploy Coursera to upskill and re-skill individuals. Segment gross margin was $16.6 million, or 68% of Enterprise revenue, compared to 70% a year ago. Our Net Retention Rate (NRR) for Paid Enterprise Customers was 113%.
- Degrees revenue for the first quarter was $12.0 million, up 81% from a year ago as prior cohorts scale and students begin newly launched programs. Segment gross margin was 100% of Degrees revenue. There is no content cost attributable to the Degrees segment as students pay tuition directly to the university, and the university pays us a fee based on the amount of tuition. The total number of Degrees Students reached 13,493, up 88% from a year ago.
All key business metrics are as of March 31, 2021. For more information regarding the metrics discussed in this press release, please see "Key Business Metrics Definitions" below.
Content and Platform Highlights
-
Content and Credentials: Expanded our stackable system of branded content and credentials from leading universities and companies:
- Announced 5 new degrees, 6 MasterTrack® programs, 4 university certificates, and a growing selection of Guided Projects to prepare learners for in-demand jobs.
- Launched 3 additional entry-level Professional Certificates from leading technology companies, including IBM and Salesforce.
- Welcomed 10 new university partners, spanning the globe from the U.S. and Latin America to the Middle East and Asia.
-
Learning Platform: Announced new platform features and functionality to support learner goals, educator efficiency, and skill-based learning within institutions:
- Learners: New features include real-time, personalized content recommendations, preferred language subtitle translations for over 2,000 top courses, and WCAG 2.1AA accessibility support across desktop and mobile experiences for learners of all abilities.
- Educators: Piloted scalable tools for educators to author content efficiently and effectively including upload-based authoring and LMS content ingestion to Coursera, speeding up the authoring process and saving educators time building their course.
- Institutions: New features include the Data Science Academy and SkillSets to help organizations develop, measure, and benchmark skills.
Highlights reflect developments since December 31, 2020 through today’s announcement. For additional information on these developments, see the Coursera Blog at blog.coursera.org.
Financial Outlook
-
Second quarter fiscal 2021:
- Revenue in the range of $89 to $93 million
- Adjusted EBITDA in the range of $(9.5) to $(12.5) million
-
Full-year fiscal 2021:
- Revenue in the range of $369 to $381 million
- Adjusted EBITDA in the range of $(45.5) to $(52.5) million
Actual results may differ materially from Coursera’s Financial Outlook as a result of, among other things, the factors described under “Special Note on Forward-Looking Statements” below.
A reconciliation of non-GAAP guidance measures to corresponding GAAP guidance measures is not available on a forward-looking basis without unreasonable effort due to the uncertainty regarding, and the potential variability of, expenses that may be incurred in the future. Stock-based compensation expense-related charges, including employer payroll tax-related items on employee stock transactions, are impacted by the timing of employee stock transactions, the future fair market value of our common stock, and our future hiring and retention needs, all of which are difficult to predict and subject to constant change. We have provided a reconciliation of GAAP to non-GAAP financial measures in the financial statement tables for our historical non-GAAP financial results included in this press release.
Conference Call Details
As previously announced, Coursera will hold a conference call to discuss its first quarter performance today, May 4, 2021 at 2:00 p.m. Pacific Time (5:00 p.m. Eastern Time).
A live, audio-only webcast of the conference call and earnings release materials will be available to the public on the company’s Investor Relations page at investor.coursera.com. For those unable to listen to the broadcast live, an archived replay will be accessible in the same location for one year.
Disclosure Information
In compliance with disclosure obligations under Regulation FD, Coursera announces material information to the public through a variety of means, including filings with the Securities and Exchange Commission, press releases, company blog posts, public conference calls and webcasts, as well as the investor relations website.
About Coursera
Coursera was launched in 2012 by two Stanford Computer Science professors, Andrew Ng and Daphne Koller, with a mission to provide universal access to world-class learning. It is now one of the largest online learning platforms in the world, with 82 million registered learners as of March 31, 2021. Coursera partners with over 200 leading university and industry partners to offer a broad catalog of content and credentials, including Guided Projects, courses, Specializations, certificates, and bachelor’s and master’s degrees. More than 6,000 institutions have used Coursera to upskill and reskill their employees, citizens, and students, including in high-demand fields such as data science, technology, and business.
Key Business Metrics Definitions
Registered Learners
We count the total number of registered learners at the end of each period. For purposes of determining our registered learner count, we treat each customer account that registers with a unique email as a registered learner and adjust for any spam, test accounts, and cancellations. Our registered learner count is not intended as a measure of active engagement. New registered learners are individuals that register in a particular period.
Paid Enterprise Customers
We count the total number of Paid Enterprise Customers at the end of each period. For purposes of determining our customer count, we treat each customer account that has a corresponding contract as a unique customer, and a single organization with multiple divisions, segments, or subsidiaries may be counted as multiple customers. We define a “Paid Enterprise Customer” as a customer who purchases Coursera via our direct sales force. For purposes of determining our Paid Enterprise Customer count, we exclude our Enterprise customers who do not purchase Coursera via our direct sales force, which include organizations engaging on our platform through our Coursera for Teams offering or through our channel partners.
Net Retention Rate (NRR) for Paid Enterprise Customers
We calculate annual recurring revenue (“ARR”) by annualizing each customer’s monthly recurring revenue (“MRR”) for the most recent month at period end. We calculate “Net Retention Rate” as of a period end by starting with the ARR from all Paid Enterprise Customers as of the twelve months prior to such period end, or Prior Period ARR. We then calculate the ARR from these same Paid Enterprise Customers as of the current period end, or Current Period ARR. Current Period ARR includes expansion within Paid Enterprise Customers and is net of contraction or attrition over the trailing twelve months, but excludes revenue from new Paid Customers in the current period. We then divide the total Current Period ARR by the total Prior Period ARR to arrive at our Net Retention Rate.
Number of Degrees Students
We count the total number of Degrees students for each period. For purposes of determining our Degrees student count, we include all the students that are matriculated in a degree program and who are enrolled in one or more courses in such degree program during the period. If a degree term spans across multiple quarters, said student is counted as active in all quarters of the degree term. For purposes of determining our Degrees student count, we do not include students who are matriculated in the degree but are not enrolled in a course in that period.
Non-GAAP Financial Measures
In addition to financial information presented in accordance with GAAP, this press release includes non-GAAP gross profit, non-GAAP net loss, adjusted EBITDA, adjusted EBITDA margin and Free Cash Flow, each of which is a non-GAAP financial measure. These are key measures used by our management to help us analyze our financial results, establish budgets and operational goals for managing our business, evaluate our performance, and make strategic decisions. Accordingly, we believe that these non-GAAP financial measures provide useful information to investors and others in understanding and evaluating our operating results in the same manner as our management and board of directors. In addition, we believe these measures are useful for period-to-period comparisons of our business. We also believe that the presentation of these non-GAAP financial measures provides an additional tool for investors to use in comparing our core business and results of operations over multiple periods with other companies in our industry, many of which present similar non-GAAP financial measures to investors, and to analyze our cash performance. However, the non-GAAP financial measures presented may not be comparable to similarly titled measures reported by other companies due to differences in the way that these measures are calculated. These non-GAAP financial measures are presented for supplemental informational purposes only and should not be considered as a substitute for or in isolation from financial information presented in accordance with GAAP. These non-GAAP metrics have limitations as analytical tools.
Non-GAAP Gross Profit and Non-GAAP Net Loss
We define non-GAAP gross profit and non-GAAP net loss as GAAP gross profit and GAAP net loss excluding the impact of stock-based compensation, and payroll tax expense related to stock-based activities. We believe the presentation of operating results that exclude these non-cash or non-recurring items provides useful supplemental information to investors and facilitates the analysis of our operating results and comparison of operating results across reporting periods.
Adjusted EBITDA and Adjusted EBITDA Margin
We define Adjusted EBITDA as our net loss excluding: (1) depreciation and amortization; (2) interest income, net; (3) stock-based compensation; (4) income tax expense; and (5) payroll tax expense related to stock-based activities. We define Adjusted EBITDA Margin as Adjusted EBITDA divided by revenue.
Free Cash Flow
Free Cash Flow is a non-GAAP financial measure that we calculate as net cash used in operating activities, less cash used for purchases of property, equipment, and software, and capitalized internal-use software costs. We exclude purchases of property, equipment and software, and capitalized internal-use software costs as we consider these capital expenditures to be a necessary component of our ongoing operations.
Reconciliations of the non-GAAP measures to the most directly comparable GAAP financial measures are included in the Appendix.
Special Note on Forward-Looking Statements
This press release contains forward-looking statements that involve substantial risks and uncertainties. Any statements contained in this press release that are not statements of historical facts may be deemed to be forward-looking statements. In some cases, you can identify forward-looking statements by the words “may,” “might,” “will,” “can,” “could,” “would,” “should,” “expect,” “intend,” “plan,” “objective,” “target,” “anticipate,” “believe,” “estimate,” “predict,” “project,” “potential,” “continue,” and “ongoing,” or the negative of these terms, or other comparable terminology intended to identify statements about the future. These forward-looking statements include statements regarding: the impact of the COVID-19 pandemic on our market, business and operations; trends in the online learning market, including with respect to developing skills for a digital future; trends in the higher education market; opportunities to drive growth for Coursera; the benefits of Coursera’s freemium model, including allowing Coursera to acquire learners at a low cost; features and anticipated benefits of our content and platform offerings; Coursera’s ability to scale its business; and our financial outlook, future financial performance, and expectations, among others. These forward-looking statements involve known and unknown risks, uncertainties, and other factors that may cause our actual results, levels of activity, performance, or achievements to be materially different from the information expressed or implied by these forward-looking statements. These risks and uncertainties include, but are not limited to, the following: our ability to manage our growth; our limited operating history; the COVID-19 pandemic’s impact on our business and our industry; the nascency of online learning solutions and risks related to market adoption of online learning; our ability to maintain and expand our partnerships with our university and industry partners; our ability to attract and retain learners; our ability to increase sales of our Enterprise offering; our ability to compete effectively; regulatory matters impacting us or our partners; risks related to intellectual property; cyber security and privacy risks and regulations; potential disruptions to our platform; and our status as a B Corp, as well as the risks discussed in our Quarterly Report on Form 10-Q for the quarter ended March 31, 2021 and as detailed from time to time in our SEC filings. You should not rely upon forward-looking statements as predictions of future events. Although we believe that the expectations reflected in the forward-looking statements are reasonable, we cannot guarantee that the future results, levels of activity, performance, or events and circumstances reflected in the forward-looking statements will be achieved or occur. Moreover, neither we nor any other person assumes responsibility for the accuracy and completeness of the forward-looking statements. Such forward-looking statements relate only to events as of the date of this press release. We undertake no obligation to update any forward-looking statements except to the extent required by law.
Coursera Inc. |
|||||||||
CONDENSED CONSOLIDATED STATEMENTS OF OPERATIONS (Unaudited) |
|||||||||
(In thousands, except number of shares and per share amounts) |
|||||||||
|
|||||||||
|
|
|
Three Months Ended March 31, |
||||||
|
|
|
2020 |
|
|
2021 |
|
||
|
|
|
(in thousands) |
||||||
Revenue |
|
$ |
53,847 |
|
|
$ |
88,362 |
|
|
Cost of revenue(1) |
|
|
24,951 |
|
|
|
38,826 |
|
|
Gross profit |
|
|
28,896 |
|
|
|
49,536 |
|
|
Operating expenses: |
|
|
|
|
|
|
|||
|
Research and development(1) |
|
|
15,783 |
|
|
|
22,140 |
|
|
Sales and marketing(1) |
|
|
20,696 |
|
|
|
32,613 |
|
|
General and administrative(1) |
|
|
7,086 |
|
|
|
13,144 |
|
Total operating expenses |
|
|
43,565 |
|
|
|
67,897 |
|
|
Loss from operations |
|
|
(14,669 |
) |
|
|
(18,361 |
) |
|
Other income (expense): |
|
|
|
|
|
|
|||
|
Interest income |
|
|
696 |
|
|
|
80 |
|
|
Other expense, net |
|
|
(252 |
) |
|
|
(7 |
) |
Loss before income taxes |
|
|
(14,225 |
) |
|
|
(18,288 |
) |
|
Income tax expense |
|
|
89 |
|
|
|
375 |
|
|
Net loss |
|
$ |
(14,314 |
) |
|
$ |
(18,663 |
) |
|
Net loss per share attributable to common stockholders—basic and diluted |
|
$ |
(0.40 |
) |
|
$ |
(0.45 |
) |
|
Weighted average shares used in computing net loss per share attributable to common stockholders—basic and diluted |
|
|
35,666,172 |
|
|
|
41,218,355 |
|
|
(1) Includes stock-based compensation expense as follows: |
|||||||
|
|
|
|
|
|
|
|
|
|
|
Three Months Ended March 31, |
||||
|
|
|
2020 |
|
2021 |
||
|
|
|
(in thousands) |
||||
|
Cost of revenue |
|
$ |
110 |
|
$ |
107 |
|
Research and development |
|
|
1,277 |
|
|
2,028 |
|
Sales and marketing |
|
|
709 |
|
|
1,347 |
|
General and administrative |
|
|
918 |
|
|
1,802 |
Total stock-based compensation expense |
|
$ |
3,014 |
|
$ |
5,284 |
|
Coursera Inc. |
||||||||||
CONDENSED CONSOLIDATED BALANCE SHEETS (Unaudited) |
||||||||||
(In thousands) |
||||||||||
|
||||||||||
|
|
|
|
December 31, 2020 |
|
March 31, 2021 |
||||
Assets: |
||||||||||
Current assets: |
|
|
|
|
|
|
||||
|
Cash and cash equivalents |
|
$ |
79,878 |
|
|
$ |
158,072 |
|
|
|
Marketable securities |
|
|
205,402 |
|
|
|
122,729 |
|
|
|
Accounts receivable, net of allowance for doubtful accounts of $48 and $146 |
|
|
40,721 |
|
|
|
35,582 |
|
|
|
Deferred costs |
|
|
14,077 |
|
|
|
16,149 |
|
|
|
Prepaid expenses and other current assets |
|
|
14,993 |
|
|
|
18,666 |
|
|
|
|
Total current assets |
|
|
355,071 |
|
|
|
351,198 |
|
Property, equipment and software, net |
|
|
18,644 |
|
|
|
21,080 |
|
||
Operating lease right-of-use assets |
|
|
21,622 |
|
|
|
20,276 |
|
||
Intangible assets, net |
|
|
10,570 |
|
|
|
10,313 |
|
||
Restricted cash |
|
|
2,548 |
|
|
|
2,548 |
|
||
Other assets |
|
|
9,169 |
|
|
|
9,407 |
|
||
|
|
Total assets |
|
$ |
417,624 |
|
|
$ |
414,822 |
|
|
|
|
|
|
|
|
|
|
||
Liabilities, Redeemable Convertible Preferred Stock, and Stockholders’ Deficit: |
||||||||||
Current liabilities: |
|
|
|
|
|
|
||||
|
Educator partners payable |
|
$ |
39,005 |
|
|
$ |
41,360 |
|
|
|
Other accounts payable |
|
|
12,897 |
|
|
|
9,813 |
|
|
|
Accrued compensation and benefits |
|
|
12,997 |
|
|
|
8,354 |
|
|
|
Operating lease liabilities, current |
|
|
7,926 |
|
|
|
7,973 |
|
|
|
Deferred revenue, current |
|
|
76,080 |
|
|
|
85,254 |
|
|
|
Other current liabilities |
|
|
4,739 |
|
|
|
5,052 |
|
|
|
|
Total current liabilities |
|
|
153,644 |
|
|
|
157,806 |
|
Operating lease liabilities, non-current |
|
|
18,305 |
|
|
|
16,676 |
|
||
Other liabilities |
|
|
644 |
|
|
|
623 |
|
||
Deferred revenue, non-current |
|
|
4,562 |
|
|
|
3,513 |
|
||
|
|
Total liabilities |
|
|
177,155 |
|
|
|
178,618 |
|
Commitments and contingencies |
|
|
|
|
|
|
||||
Redeemable convertible preferred stock: |
|
|
462,293 |
|
|
|
462,293 |
|
||
Stockholders’ deficit: |
|
|
|
|
|
|
||||
|
Common Stock |
|
|
— |
|
|
|
— |
|
|
|
Additional paid-in capital |
|
|
126,408 |
|
|
|
140,803 |
|
|
|
Treasury stock |
|
|
(4,701 |
) |
|
|
(4,701 |
) |
|
|
Accumulated other comprehensive income |
|
|
20 |
|
|
|
23 |
|
|
|
Accumulated deficit |
|
|
(343,551 |
) |
|
|
(362,214 |
) |
|
|
|
Total stockholders’ deficit |
|
|
(221,824 |
) |
|
|
(226,089 |
) |
|
|
Total liabilities, redeemable convertible preferred stock, stockholders’ deficit |
|
$ |
417,624 |
|
|
$ |
414,822 |
|
Coursera Inc. |
||||||||||||
CONDENSED CONSOLIDATED STATEMENTS OF CASH FLOWS (Unaudited) |
||||||||||||
(In thousands) |
||||||||||||
|
||||||||||||
|
|
|
|
|
|
Three Months Ended March 31, |
||||||
|
|
|
|
|
|
2020 |
|
|
2021 |
|
||
Cash flows from operating activities: |
|
|
|
|
|
|
||||||
|
Net loss |
|
$ |
(14,314 |
) |
|
$ |
(18,663 |
) |
|||
|
Adjustments to reconcile net loss to net cash used in operating activities: |
|
|
|
|
|
|
|||||
|
|
Depreciation and amortization |
|
|
1,993 |
|
|
|
2,931 |
|
||
|
|
Stock-based compensation |
|
|
3,014 |
|
|
|
5,284 |
|
||
|
|
Amortization or accretion of marketable securities |
|
|
(149 |
) |
|
|
177 |
|
||
|
|
Other |
|
|
40 |
|
|
|
98 |
|
||
|
|
|
Changes in operating assets and liabilities: |
|
|
|
|
|
|
|||
|
|
|
Accounts receivable, net |
|
|
(3,414 |
) |
|
|
5,041 |
|
|
|
|
|
Prepaid expenses and other assets |
|
|
909 |
|
|
|
260 |
|
|
|
|
|
Operating lease right-of-use assets |
|
|
1,264 |
|
|
|
1,345 |
|
|
|
|
|
Educator partners and other accounts payable |
|
|
2,133 |
|
|
|
(3,032 |
) |
|
|
|
|
Accrued and other liabilities |
|
|
(7,052 |
) |
|
|
(4,330 |
) |
|
|
|
|
Operating lease liabilities |
|
|
(1,368 |
) |
|
|
(1,582 |
) |
|
|
|
|
Deferred revenue |
|
|
9,408 |
|
|
|
8,124 |
|
|
|
|
|
|
Net cash used in operating activities |
|
|
(7,536 |
) |
|
|
(4,347 |
) |
Cash flows from investing activities: |
|
|
|
|
|
|
||||||
|
Purchases of marketable securities |
|
|
(5,939 |
) |
|
|
— |
|
|||
|
Proceeds from maturities of marketable securities |
|
|
63,359 |
|
|
|
82,500 |
|
|||
|
Purchases of property, equipment, and software |
|
|
(582 |
) |
|
|
(307 |
) |
|||
|
Capitalized internal-use software costs |
|
|
(1,774 |
) |
|
|
(3,985 |
) |
|||
|
Purchases of content assets |
|
|
— |
|
|
|
(170 |
) |
|||
|
|
|
|
Net cash provided by investing activities |
|
|
55,064 |
|
|
|
78,038 |
|
Cash flows from financing activities: |
|
|
|
|
|
|
||||||
|
Proceeds from exercise of stock options |
|
|
421 |
|
|
|
8,564 |
|
|||
|
Payment of deferred offering costs |
|
|
— |
|
|
|
(4,061 |
) |
|||
|
|
|
|
Net cash provided by financing activities |
|
|
421 |
|
|
|
4,503 |
|
Net increase in cash, cash equivalents, and restricted cash |
|
|
47,949 |
|
|
|
78,194 |
|
||||
Cash, cash equivalents, and restricted cash—Beginning of period |
|
|
59,845 |
|
|
|
82,426 |
|
||||
Cash, cash equivalents, and restricted cash—End of period |
|
$ |
107,794 |
|
|
$ |
160,620 |
|
||||
Cash, cash equivalents, and restricted cash—End of period |
|
|
|
|
|
|
||||||
|
Cash and cash equivalents |
|
$ |
103,935 |
|
|
$ |
158,072 |
|
|||
|
Restricted cash |
|
|
3,090 |
|
|
|
2,548 |
|
|||
|
Restricted cash in prepaid expenses and other current assets |
|
|
769 |
|
|
|
— |
|
|||
Cash, cash equivalents, and restricted cash—End of period |
|
$ |
107,794 |
|
|
$ |
160,620 |
|
||||
Coursera Inc. |
|||||||||||
RECONCILIATION OF GAAP TO NON-GAAP FINANCIAL MEASURES (Unaudited) |
|||||||||||
(In thousands, except number of shares and per share amounts) |
|||||||||||
Three Months Ended March 31, 2021 |
|||||||||||
|
|||||||||||
|
|
GAAP |
Stock-based Compensation |
Payroll tax expense related to stock-based activities |
Non-GAAP |
||||||
Revenue |
$ |
88,362 |
|
|
|
$ |
88,362 |
|
|||
Cost of revenue |
|
38,826 |
|
(107 |
) |
(1 |
) |
|
38,718 |
|
|
Gross profit |
|
49,536 |
|
107 |
|
1 |
|
|
49,644 |
|
|
Operating expenses: |
|
|
|
|
|
|
|||||
|
Research and development |
|
22,140 |
|
(2,028 |
) |
(23 |
) |
|
20,089 |
|
|
Sales and marketing |
|
32,613 |
|
(1,347 |
) |
(1 |
) |
|
31,265 |
|
|
General and administrative |
|
13,144 |
|
(1,802 |
) |
(2 |
) |
|
11,340 |
|
Total operating expenses |
|
67,897 |
|
(5,177 |
) |
(26 |
) |
|
62,694 |
|
|
Loss from operations |
|
(18,361 |
) |
5,284 |
|
27 |
|
|
(13,050 |
) |
|
|
Interest income |
|
80 |
|
|
|
|
80 |
|
||
|
Other expense, net |
|
(7 |
) |
|
|
|
(7 |
) |
||
Loss before income taxes |
|
(18,288 |
) |
5,284 |
|
27 |
|
|
(12,977 |
) |
|
Income tax expense |
|
375 |
|
- |
|
- |
|
|
375 |
|
|
Net loss |
$ |
(18,663 |
) |
5,284 |
|
27 |
|
$ |
(13,352 |
) |
|
Net loss margin (a), (b) |
|
(21 |
)% |
|
|
|
(15 |
)% |
|||
Net loss per share attributable to common stockholders—basic and diluted |
$ |
(0.45 |
) |
|
|
$ |
(0.32 |
) |
|||
Weighted average shares used in computing net loss per share attributable to common stockholders—basic and diluted |
|
41,218,355 |
|
|
|
|
41,218,355 |
|
|||
|
|
|
|
|
|
|
|
||||
|
|
|
|
|
|
|
|
||||
(a) Net loss margin is defined as net loss divided by revenue. |
|||||||||||
(b) Non-GAAP net loss margin is defined as non-GAAP net loss margin divided by revenue. |
|||||||||||
Three Months Ended March 31, 2020
|
|
GAAP |
Stock-based Compensation |
Payroll tax expense related to stock-based activities |
Non-GAAP |
|||||
Revenue |
$ |
53,847 |
|
|
|
$ |
53,847 |
|
||
Cost of revenue |
|
24,951 |
|
(110 |
) |
— |
|
24,841 |
|
|
Gross profit |
|
28,896 |
|
110 |
|
— |
|
29,006 |
|
|
Operating expenses: |
|
|
|
|
|
|
||||
|
Research and development |
|
15,783 |
|
(1,277 |
) |
— |
|
14,506 |
|
|
Sales and marketing |
|
20,696 |
|
(709 |
) |
— |
|
19,987 |
|
|
General and administrative |
|
7,086 |
|
(918 |
) |
— |
|
6,168 |
|
Total operating expenses |
|
43,565 |
|
(2,904 |
) |
— |
|
40,661 |
|
|
Loss from operations |
|
(14,669 |
) |
3,014 |
|
— |
|
(11,655 |
) |
|
|
Interest income |
|
696 |
|
|
|
|
696 |
|
|
|
Other expense, net |
|
(252 |
) |
|
|
|
(252 |
) |
|
Loss before income taxes |
|
(14,225 |
) |
3,014 |
|
— |
|
(11,211 |
) |
|
Income tax expense |
|
89 |
|
— |
|
— |
|
89 |
|
|
Net loss |
$ |
(14,314 |
) |
3,014 |
|
— |
$ |
(11,300 |
) |
|
Net loss margin (a), (b) |
|
(27 |
)% |
|
|
|
(21 |
)% |
||
Net loss per share attributable to common stockholders—basic and diluted |
$ |
(0.40 |
) |
|
|
$ |
(0.32 |
) |
||
Weighted average shares used in computing net loss per share attributable to common stockholders—basic and diluted |
|
35,666,172 |
|
|
|
|
35,666,172 |
|
||
|
|
|
|
|
|
|
|
|||
|
|
|
|
|
|
|
|
|||
(a) Net loss margin is defined as net loss divided by revenue. |
||||||||||
(b) Non-GAAP net loss margin is defined as non-GAAP net loss margin divided by revenue. |
||||||||||
|
|
|
Three Months Ended March 31, |
||||||
|
|
|
2020 |
|
|
|
2021 |
|
|
|
|
|
(in thousands) |
||||||
Net loss |
|
$ |
(14,314 |
) |
|
$ |
(18,663 |
) |
|
|
Depreciation and amortization |
|
|
1,993 |
|
|
|
2,931 |
|
|
Interest income, net |
|
|
(696 |
) |
|
|
(80 |
) |
|
Stock-based compensation |
|
|
3,014 |
|
|
|
5,284 |
|
|
Income tax expense |
|
|
89 |
|
|
|
375 |
|
|
Payroll tax expense related to stock-based activities |
|
|
- |
|
|
|
27 |
|
Adjusted EBITDA |
|
$ |
(9,914 |
) |
|
$ |
(10,126 |
) |
|
|
|
|
|
|
|
|
|
||
|
|
|
|
|
|
|
|
||
|
|
|
Three Months Ended March 31, |
||||||
|
|
|
2020 |
|
|
|
2021 |
|
|
|
|
|
(in thousands, except percentages) |
||||||
Revenue |
|
$ |
53,847 |
|
|
$ |
88,362 |
|
|
Net loss |
|
$ |
(14,314 |
) |
|
$ |
(18,663 |
) |
|
GAAP net loss margin |
|
|
(27 |
)% |
|
|
(21 |
)% |
|
Revenue |
|
$ |
53,847 |
|
|
$ |
88,362 |
|
|
Adjusted EBITDA |
|
$ |
(9,914 |
) |
|
$ |
(10,126 |
) |
|
Adjusted EBITDA margin |
|
|
(18 |
)% |
|
|
(11 |
)% |
|
|
|
|
|
|
|
|
|
||
|
|
|
|
|
|
|
|
||
|
|
|
Three Months Ended March 31, |
||||||
|
|
|
2020 |
|
|
|
2021 |
|
|
|
|
|
(in thousands) |
||||||
Net cash used in operating activities |
|
$ |
(7,536 |
) |
|
$ |
(4,347 |
) |
|
Less: Purchases of property, equipment, and software |
|
|
(582 |
) |
|
|
(307 |
) |
|
Less: Capitalized internal-use software costs |
|
|
(1,774 |
) |
|
|
(3,985 |
) |
|
Free Cash Flow |
|
$ |
(9,892 |
) |
|
$ |
(8,639 |
) |
|
Source Code: COUR-IR
View source version on businesswire.com: https://www.businesswire.com/news/home/20210504006267/en/
Contacts
For investors: Cam Carey, ir@coursera.org
For media: Arunav Sinha, press@coursera.org


