
Server solutions provider Super Micro (NASDAQ: SMCI) missed Wall Street’s revenue expectations in Q3 CY2025, with sales falling 15.5% year on year to $5.02 billion. On the other hand, next quarter’s outlook exceeded expectations with revenue guided to $10.5 billion at the midpoint, or 31.5% above analysts’ estimates. Its non-GAAP profit of $0.35 per share was 10.1% below analysts’ consensus estimates.
Is now the time to buy Super Micro? Find out by accessing our full research report, it’s free for active Edge members.
Super Micro (SMCI) Q3 CY2025 Highlights:
- Revenue: $5.02 billion vs analyst estimates of $5.78 billion (15.5% year-on-year decline, 13.2% miss)
- Adjusted EPS: $0.35 vs analyst expectations of $0.39 (10.1% miss)
- Adjusted EBITDA: $334.9 million vs analyst estimates of $337.6 million (6.7% margin, 0.8% miss)
- The company lifted its revenue guidance for the full year to $36 billion at the midpoint from $33 billion, a 9.1% increase
- Adjusted EPS guidance for Q4 CY2025 is $0.50 at the midpoint, below analyst estimates of $0.62
- Operating Margin: 3.6%, down from 8.6% in the same quarter last year
- Free Cash Flow was -$949.8 million, down from $364.6 million in the same quarter last year
- Market Capitalization: $30.16 billion
Company Overview
Founded in Silicon Valley in 1993 and known for its modular "building block" approach to server design, Super Micro Computer (NASDAQ: SMCI) designs and manufactures high-performance, energy-efficient server and storage systems for data centers, cloud computing, AI, and edge computing applications.
Revenue Growth
Examining a company’s long-term performance can provide clues about its quality. Even a bad business can shine for one or two quarters, but a top-tier one grows for years.
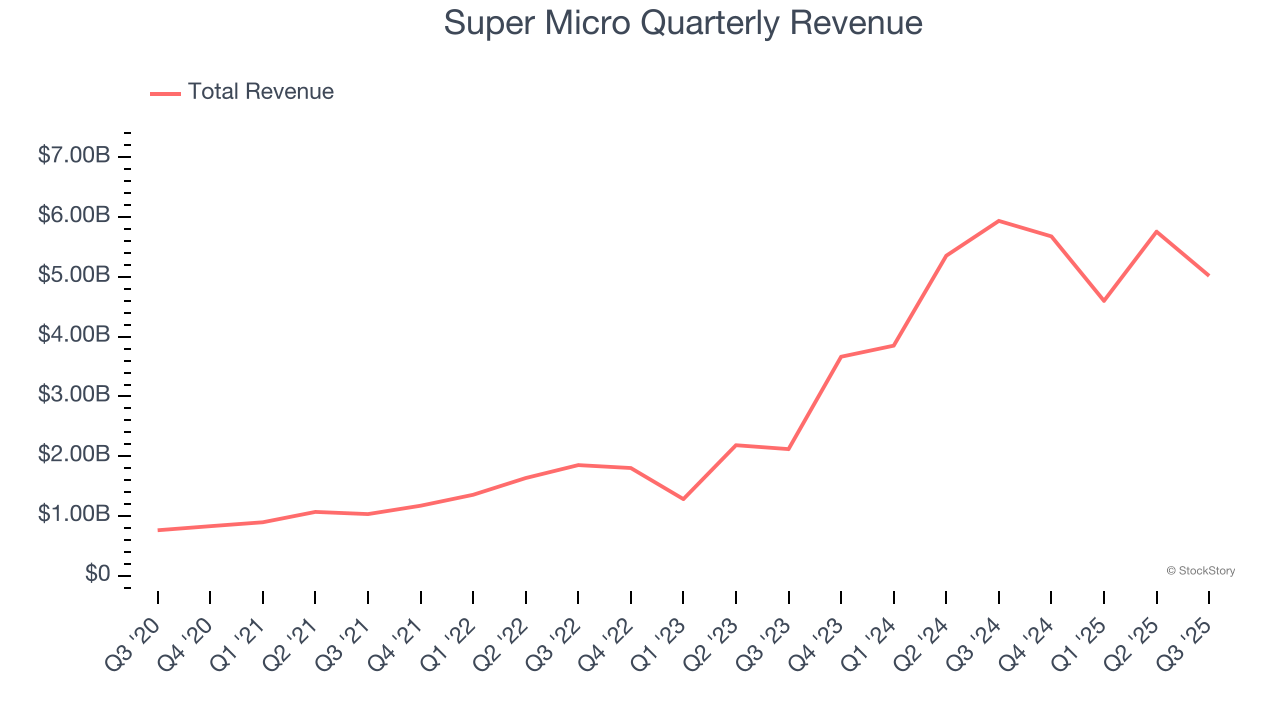
With $21.05 billion in revenue over the past 12 months, Super Micro is a behemoth in the business services sector and benefits from economies of scale, giving it an edge in distribution. This also enables it to gain more leverage on its fixed costs than smaller competitors and the flexibility to offer lower prices.
As you can see below, Super Micro grew its sales at an incredible 44.8% compounded annual growth rate over the last five years. This is a great starting point for our analysis because it shows Super Micro’s demand was higher than many business services companies.
We at StockStory place the most emphasis on long-term growth, but within business services, a half-decade historical view may miss recent innovations or disruptive industry trends. Super Micro’s annualized revenue growth of 68.8% over the last two years is above its five-year trend, suggesting its demand was strong and recently accelerated. 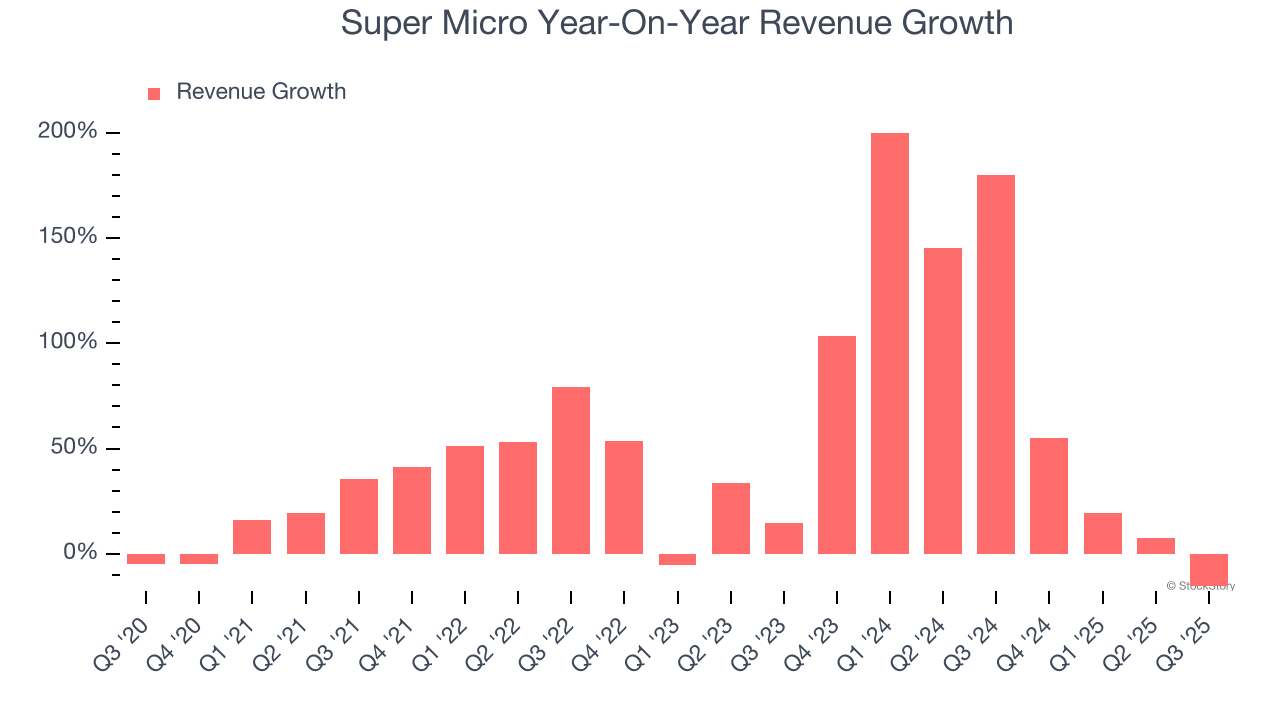
This quarter, Super Micro missed Wall Street’s estimates and reported a rather uninspiring 15.5% year-on-year revenue decline, generating $5.02 billion of revenue. Company management is currently guiding for a 84.9% year-on-year increase in sales next quarter.
Looking further ahead, sell-side analysts expect revenue to grow 71% over the next 12 months, an improvement versus the last two years. This projection is eye-popping for a company of its scale and suggests its newer products and services will catalyze better top-line performance.
Software is eating the world and there is virtually no industry left that has been untouched by it. That drives increasing demand for tools helping software developers do their jobs, whether it be monitoring critical cloud infrastructure, integrating audio and video functionality, or ensuring smooth content streaming. Click here to access a free report on our 3 favorite stocks to play this generational megatrend.
Operating Margin
Operating margin is a key measure of profitability. Think of it as net income - the bottom line - excluding the impact of taxes and interest on debt, which are less connected to business fundamentals.
Super Micro was profitable over the last five years but held back by its large cost base. Its average operating margin of 6.7% was weak for a business services business.
On the plus side, Super Micro’s operating margin rose by 1.2 percentage points over the last five years, as its sales growth gave it operating leverage.
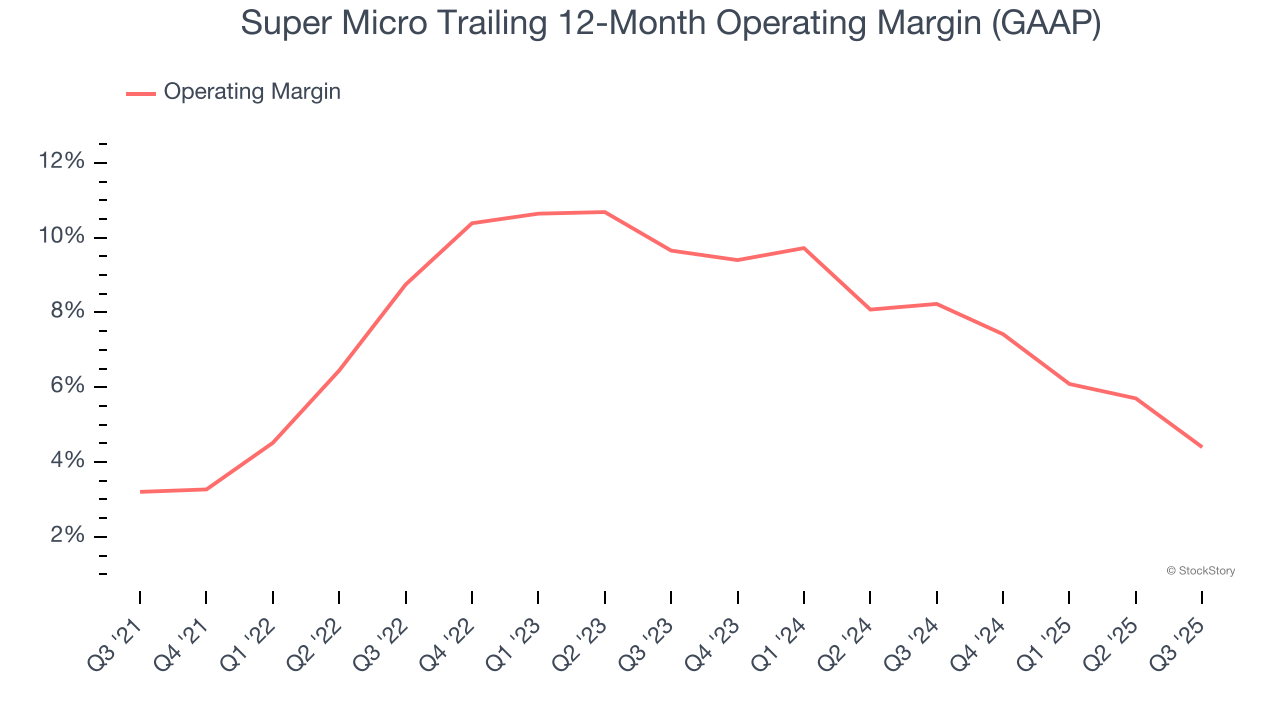
In Q3, Super Micro generated an operating margin profit margin of 3.6%, down 4.9 percentage points year on year. This contraction shows it was less efficient because its expenses increased relative to its revenue.
Earnings Per Share
We track the long-term change in earnings per share (EPS) for the same reason as long-term revenue growth. Compared to revenue, however, EPS highlights whether a company’s growth is profitable.
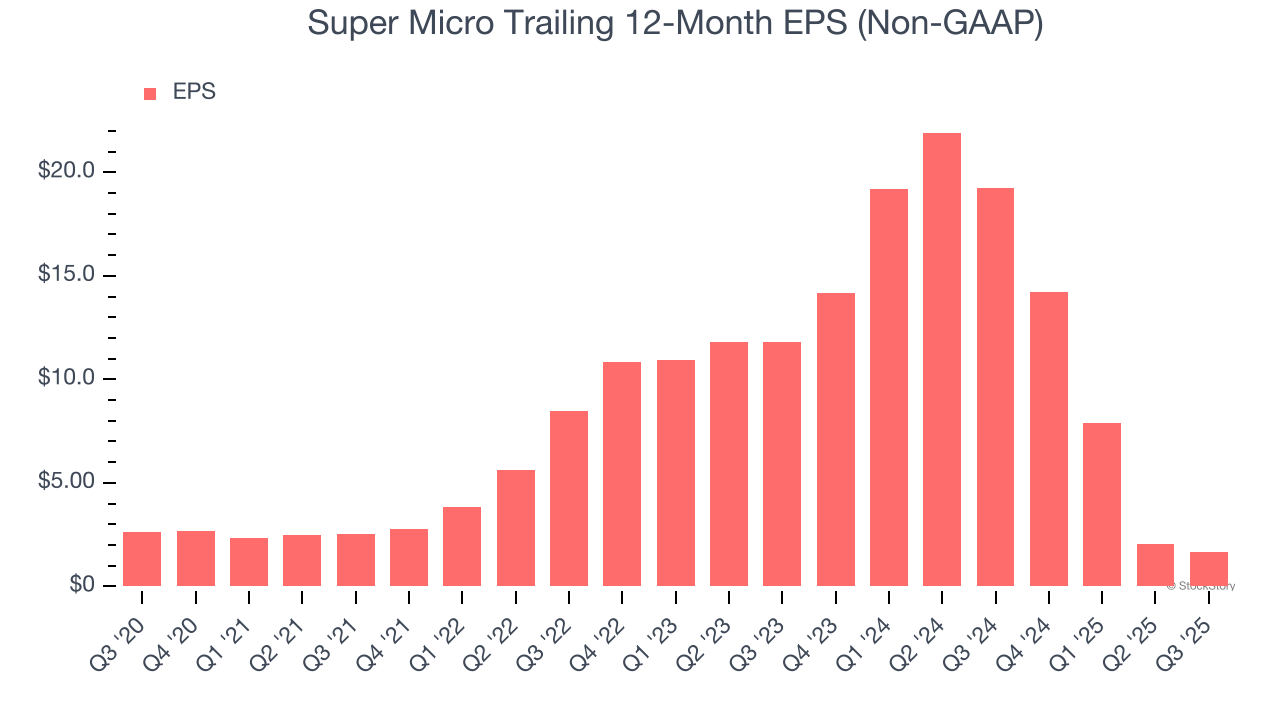
Sadly for Super Micro, its EPS declined by 8.7% annually over the last five years while its revenue grew by 44.8%. However, its operating margin actually improved during this time, telling us that non-fundamental factors such as interest expenses and taxes affected its ultimate earnings.
Diving into the nuances of Super Micro’s earnings can give us a better understanding of its performance. A five-year view shows Super Micro has diluted its shareholders, growing its share count by 21.9%. This dilution overshadowed its increased operational efficiency and has led to lower per share earnings. Taxes and interest expenses can also affect EPS but don’t tell us as much about a company’s fundamentals. 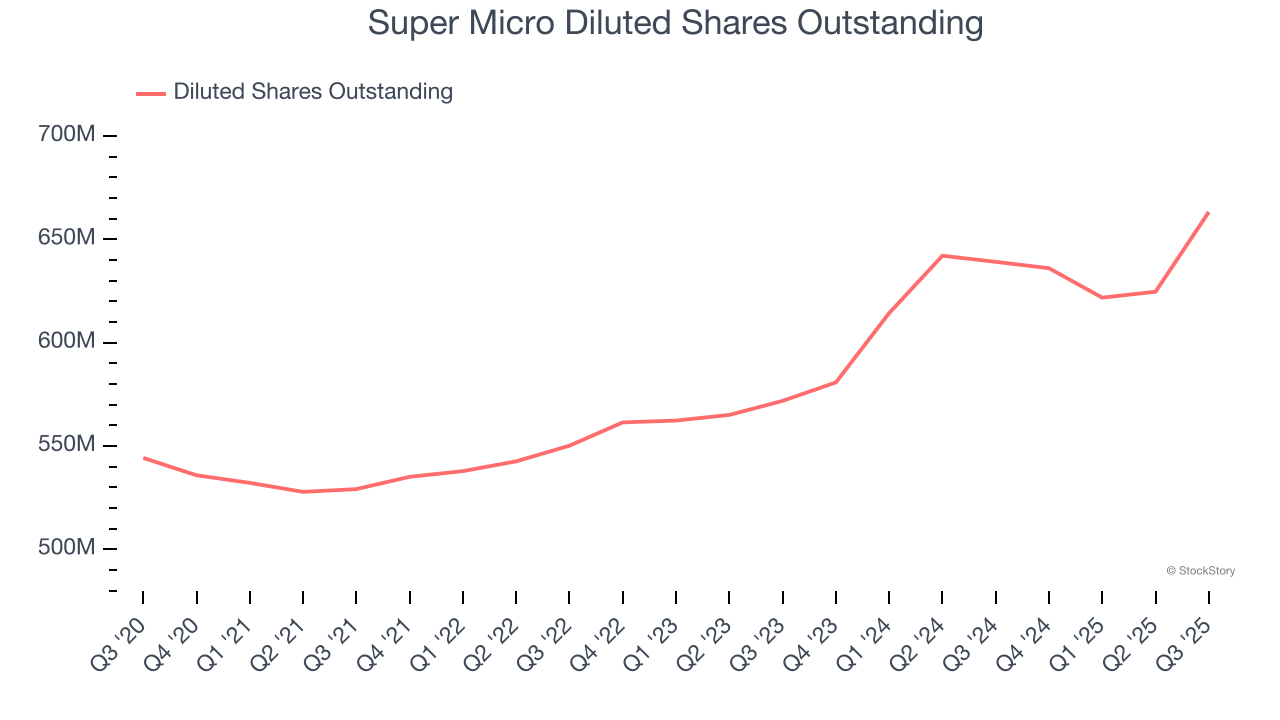
Like with revenue, we analyze EPS over a shorter period to see if we are missing a change in the business.
For Super Micro, its two-year annual EPS declines of 62.4% show it’s continued to underperform. These results were bad no matter how you slice the data, but given it was successful in other measures of financial health, we’re hopeful Super Micro can generate earnings growth in the future.
In Q3, Super Micro reported adjusted EPS of $0.35, down from $0.74 in the same quarter last year. This print missed analysts’ estimates. Over the next 12 months, Wall Street expects Super Micro’s full-year EPS of $1.67 to grow 75.8%.
Key Takeaways from Super Micro’s Q3 Results
We were impressed by Super Micro’s optimistic revenue guidance for next quarter, which blew past analysts’ expectations. On the other hand, its revenue and EPS missed significantly. Overall, this quarter could have been better. The stock traded down 5.8% to $44.74 immediately after reporting.
Super Micro underperformed this quarter, but does that create an opportunity to invest right now? If you’re making that decision, you should consider the bigger picture of valuation, business qualities, as well as the latest earnings. We cover that in our actionable full research report which you can read here, it’s free for active Edge members.