Nasdaq Peak? Time to Rotate into the Russell 2000 Small Cap Index
It’s been a banner year for the benchmark indexes like the Nasdaq 100 Invesco QQQ ETF (NASDAQ: QQQ), which is up 45%, despite the special rebalancing, or the S&P 500 index SPDR S&P 500 ETF Trust (NYSEARCA: SPY) up 20% year-to-date (YTD). The Russell 2000 Small-Cap index iShares Russell 2000 ETF (NYSEARCA: IWM) is up just 14.35% YTD.
Portfolio managers that have fallen behind in their performance against the major benchmark indices may be motivated to step into the laggard small-caps as a last resort to improve performance.
Index Rotation
Money tends to trickle down from the leaders to the laggards in the stock market. The small-caps are naturally riskier stocks, but when the major indices are up so much, the smart money always looks to rotate into the laggards. Small-caps are the laggard, and risk is proportionate to reward.
Rather than chasing already high multiple stocks, small-caps provide an opportunity for more upside moving forward. The thinking is plausible when looking at the IWM chart setting up for a breakout through the 15-month weekly rectangle pattern.
The Float-Adjusted Market-Cap Weight Index
The IWM is the standard ETF tracking the Russell 2000 index. The Russell 2000 index is a float-adjusted capitalization-weighted index representing the performance of the 2,000 smallest issuers of the Russell 3000 index.
A float-adjusted market cap-weighted index determines market capitalization based on the stock price multiplied by the free-float number of shares, not the number of outstanding shares like in a market-cap-weighted index.
Calculating Free-Float Shares
The free float is calculated by subtracting shares that aren't available to the general public trade, which includes insider shares, controlling interest and beneficial owner shares and certain institutional shares. The float is almost always less than the total number of outstanding shares.
Also, having 2,000 component companies versus 500 or 100 companies also spreads out the concentration even more, making it tougher for any handful of companies to make much impact on the overall index.
Float-Adjusted Versus Weighted Indexes
This differentiates it from market-cap-weighted indexes like the S&P 500 and Nasdaq 100 index, where larger companies can significantly impact performance. A company's influence on the index is proportionate to its float-adjusted market value.
Since stocks can have less liquidity since small-caps have fewer participants and wider spreads, an exceptionally large price swing for smaller companies won't have as much impact as the same swing in a larger company.
Big price swings can be common in small-cap stocks.
Top Weightings
The float-adjusted market-cap weighting does a good job of preventing a small number of companies with large moves from making too much impact on the index. It’s a built-in diversification mechanism. The top five sector percentages of weightings are split between industrials at 16.71%, financials at 16.27%, health care at 16.05%, information technology at 13.47% and consumer discretionary at 10.58%.
The top four companies make up just over 1% of the index. Individually, they are up large on the year but have little overall impact due to their float-adjusted market caps. The largest weighting is high-performance server technology provider Super Micro Computer Inc. (NASDAQ: SMCI) with a 0.62% weighting but a performance of up 289% YTD.
Industrial clean energy cryogenic equipment maker Chart Industries Inc. (NYSE: GTLS) has a 0.29% weighting and is up 55.71% YTD. Oil and gas technology solutions provider ChampionX Co. (NASDAQ: CHX) has a weighting of 0.28% and a 27.46% YTD performance.
Semiconductor company and former high flyer Rambus Inc. (NASDAQ: RMBS) makes up 0.27% of the index and is up 79% YTD.
Weekly Rectangle Breakout Pattern
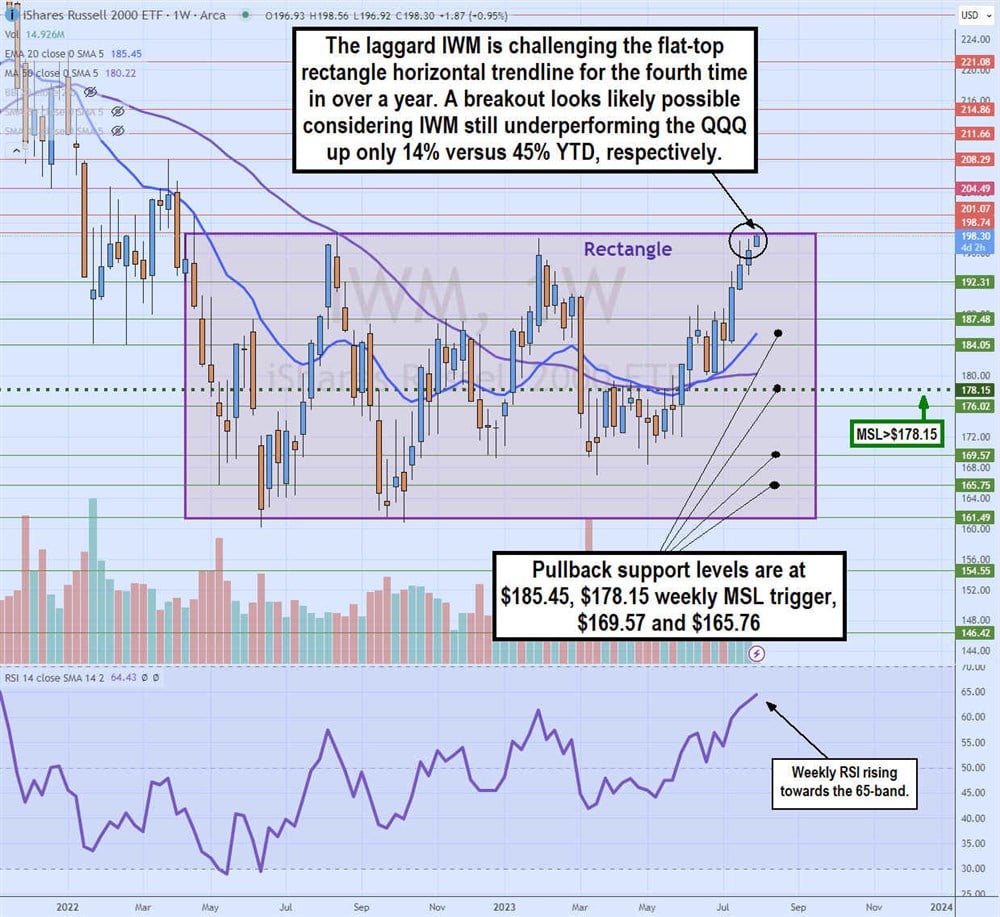
The weekly candlestick chart on IWM shows a clear flat-top resistance horizontal trendline at $198.25, which failed on three earlier attempts dating back to April 2022 that failed. The flat-bottom trendline support is around $161.49. These two horizontal trend lines connected form a weekly rectangle over 15 months old.
However, the IWM has been on a tear after triggering the weekly market structure low (MSL) breakout through the $178.15 trigger. Shares climbed for the past four weeks to re-test the $198.29 resistance powered by the rising weekly relative strength index (RSI) as it approaches the 70-band. Will the fourth time be the charm on the breakout attempt?
Pullback supports are at $185.45 weekly 20-period exponential moving average (EMA), $178.15 weekly MSL trigger, $169.57 and $165.76.
More News
View More


Recent Quotes
View More
Quotes delayed at least 20 minutes.
By accessing this page, you agree to the Privacy Policy and Terms Of Service.