Oak View Bankshares, Inc. Announces Another Strong Quarter of Performance
By:
ACCESSWIRE
July 24, 2024 at 11:20 AM EDT
WARRENTON, VA / ACCESSWIRE / July 24, 2024 / Oak View Bankshares, Inc. (the "Company") (OTC Pink:OAKV), parent company of Oak View National Bank (the "Bank"), reported net income of $1.83 million for the quarter ended June 30, 2024, compared to net income of $1.03 million for the quarter ended June 30, 2023, an increase of 76.89%. Net income for the six months ended June 30, 2024, was $3.17 million, compared to $2.05 million for the six months ended June 30, 2023, an increase of 54.79%. 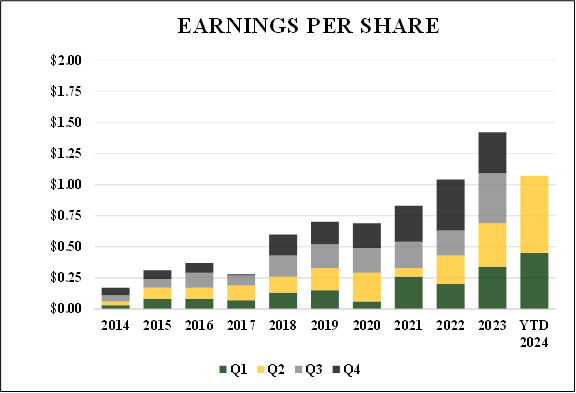 Basic and diluted earnings per share were $0.62 per share for the quarter ended June 30, 2024, compared to $0.35 for the quarter ended June 30, 2023. Basic and diluted earnings per share for the six months ended June 30, 2024, were $1.07 compared to $0.69 for the six months ended June 30, 2023. "As always, our goal is to strike the optimal balance among safety and soundness, profitability, and growth," said Michael Ewing, CEO and Chairman of the Board. Prudent financial management allows us to meet the financial needs of our communities while building durable value for our shareholders. These are challenging times for many in the banking industry due to high short-term interest rates and an inverted yield curve. While many community depositories pull back, we are pushing forward. We have continued to earn deposit and lending share, recruit top talent, expand our product suite, and fortify our foundation for growth - all while strengthening our financial performance. As shown in the graph, our earnings per share have increased dramatically over the past decade. Above all, this is a testament to the hard work of our teammates and the commitment of the communities we are so privileged to serve." Selected Highlights:
Net Interest Income The net interest margin was 2.99% for the quarter ended June 30, 2024, compared to 2.96% for the quarter ended June 30, 2023. Net interest income was $4.52 million for the quarter ended June 30, 2024, compared to $3.93 million for the quarter ended June 30, 2023. Average earning assets and the related yield increased to $607.92 million and 5.87%, respectively, for the quarter ended June 30, 2024, compared to $533.83 million and 5.07%, respectively, for the quarter ended June 30, 2023. Average interest-bearing liabilities and the related cost of funds increased to $493.34 million and 3.54%, respectively, for the quarter ended June 30, 2024, compared to $420.30 million and 2.68%, respectively, for the quarter ended June 30, 2023. The net interest margin was 2.95% for the six months ended June 30, 2024, compared to 3.02% for the six months ended June 30, 2023. Net interest income was $8.78 million for the six months ended June 30, 2024, compared to $7.75 million for the six months ended June 30, 2023. Average earning assets and the related yield increased to $599.96 million and 5.79%, respectively, for the six months ended June 30, 2024, compared to $519.48 million and 4.97%, respectively, for the six months ended June 30, 2023. Average interest-bearing liabilities and the related cost of funds increased to $486.35 million and 3.51%, respectively, for the six months ended June 30, 2024, compared to $404.84 million and 2.51%, respectively, for the six months ended June 30, 2023. Noninterest Income Noninterest income was $0.74 million and $1.17 million for the quarter and six months ended June 30, 2024, respectively, compared to $0.39 million and $0.73 million for the quarter and six months ended June 30, 2023, respectively. Contributing to noninterest income for the quarter and six months ended June 30, 2024, were net gains on sales of available for sale securities of $0.33 million and $0.43 million, respectively. Proceeds from the sale of these securities were redeployed into assets with more attractive risk and return characteristics. Interchange fee income, resulting from increased transaction volume, of $0.21 million and $0.39 million also contributed to noninterest income for the quarter and six months ended June 30, 2024. Noninterest Expense Noninterest expenses were $2.89 million and $5.81 million for the quarter and six months ended June 30, 2024, respectively, compared to $2.85 million and $5.64 million for the quarter and six months ended June 30, 2023, respectively. Annualized noninterest expenses to average assets were 1.86% and 1.90% for the quarter and six months ended, June 30, 2024, respectively, compared to 2.08% and 2.14% for the quarter and six months ended June 30, 2023, respectively. Liquidity Liquidity remains exceptionally strong with $501.49 million of liquid assets available which included cash, unencumbered securities available for sale, and secured and unsecured borrowing capacity as of June 30, 2024, compared to $453.9 million as of December 31, 2023. The Company's deposits proved to be stable with core deposits, which are defined as total deposits excluding brokered deposits, of $467.65 million as of June 30, 2024, compared to $443.26 million as of December 31, 2023. Uninsured deposits, those deposits that exceed FDIC insurance limits, were $92.09 million as of June 30, 2024, or 19.69% of total deposits, well within industry averages. Asset Quality As of June 30, 2024, the allowance for credit losses related to the loan portfolio was $2.94 million or 0.93% of outstanding loans,net of unearned income compared to $2.79 million or 0.92% as of December 31, 2023. The increase in the allowance for credit losses was primarily due to the growth in the loan portfolio. The provision for credit losses was $0.06 million and $0.13 million for the quarter and six months ended June 30, 2024, respectively, compared to $0.16 million and $0.25 million for the quarter and six months ended June 30, 2023, respectively. Shareholders' Equity & Regulatory Capital Shareholders' equity was $35.46 million on June 30, 2024, compared to $32.67 million on December 31, 2023. Accumulated other comprehensive loss was $2.71 million as of June 30, 2024, compared to $2.99 million as of December 31, 2023. These unrealized losses are primarily related to mark-to-market adjustments on U.S. Treasury bonds within the available-for-sale securities portfolio related to changes in interest rates. About Oak View Bankshares, Inc. and Oak View National Bank Oak View Bankshares, Inc. is the parent bank holding company for Oak View National Bank, a locally owned and managed community bank serving Fauquier, Culpeper, Rappahannock, and surrounding Counties. For more information about Oak View Bankshares, Inc. and Oak View National Bank, please visit our website at www.oakviewbank.com. Member FDIC. For additional information, contact Tammy Frazier, Executive Vice President & Chief Financial Officer, Oak View Bankshares, Inc., at 540-359-7155. 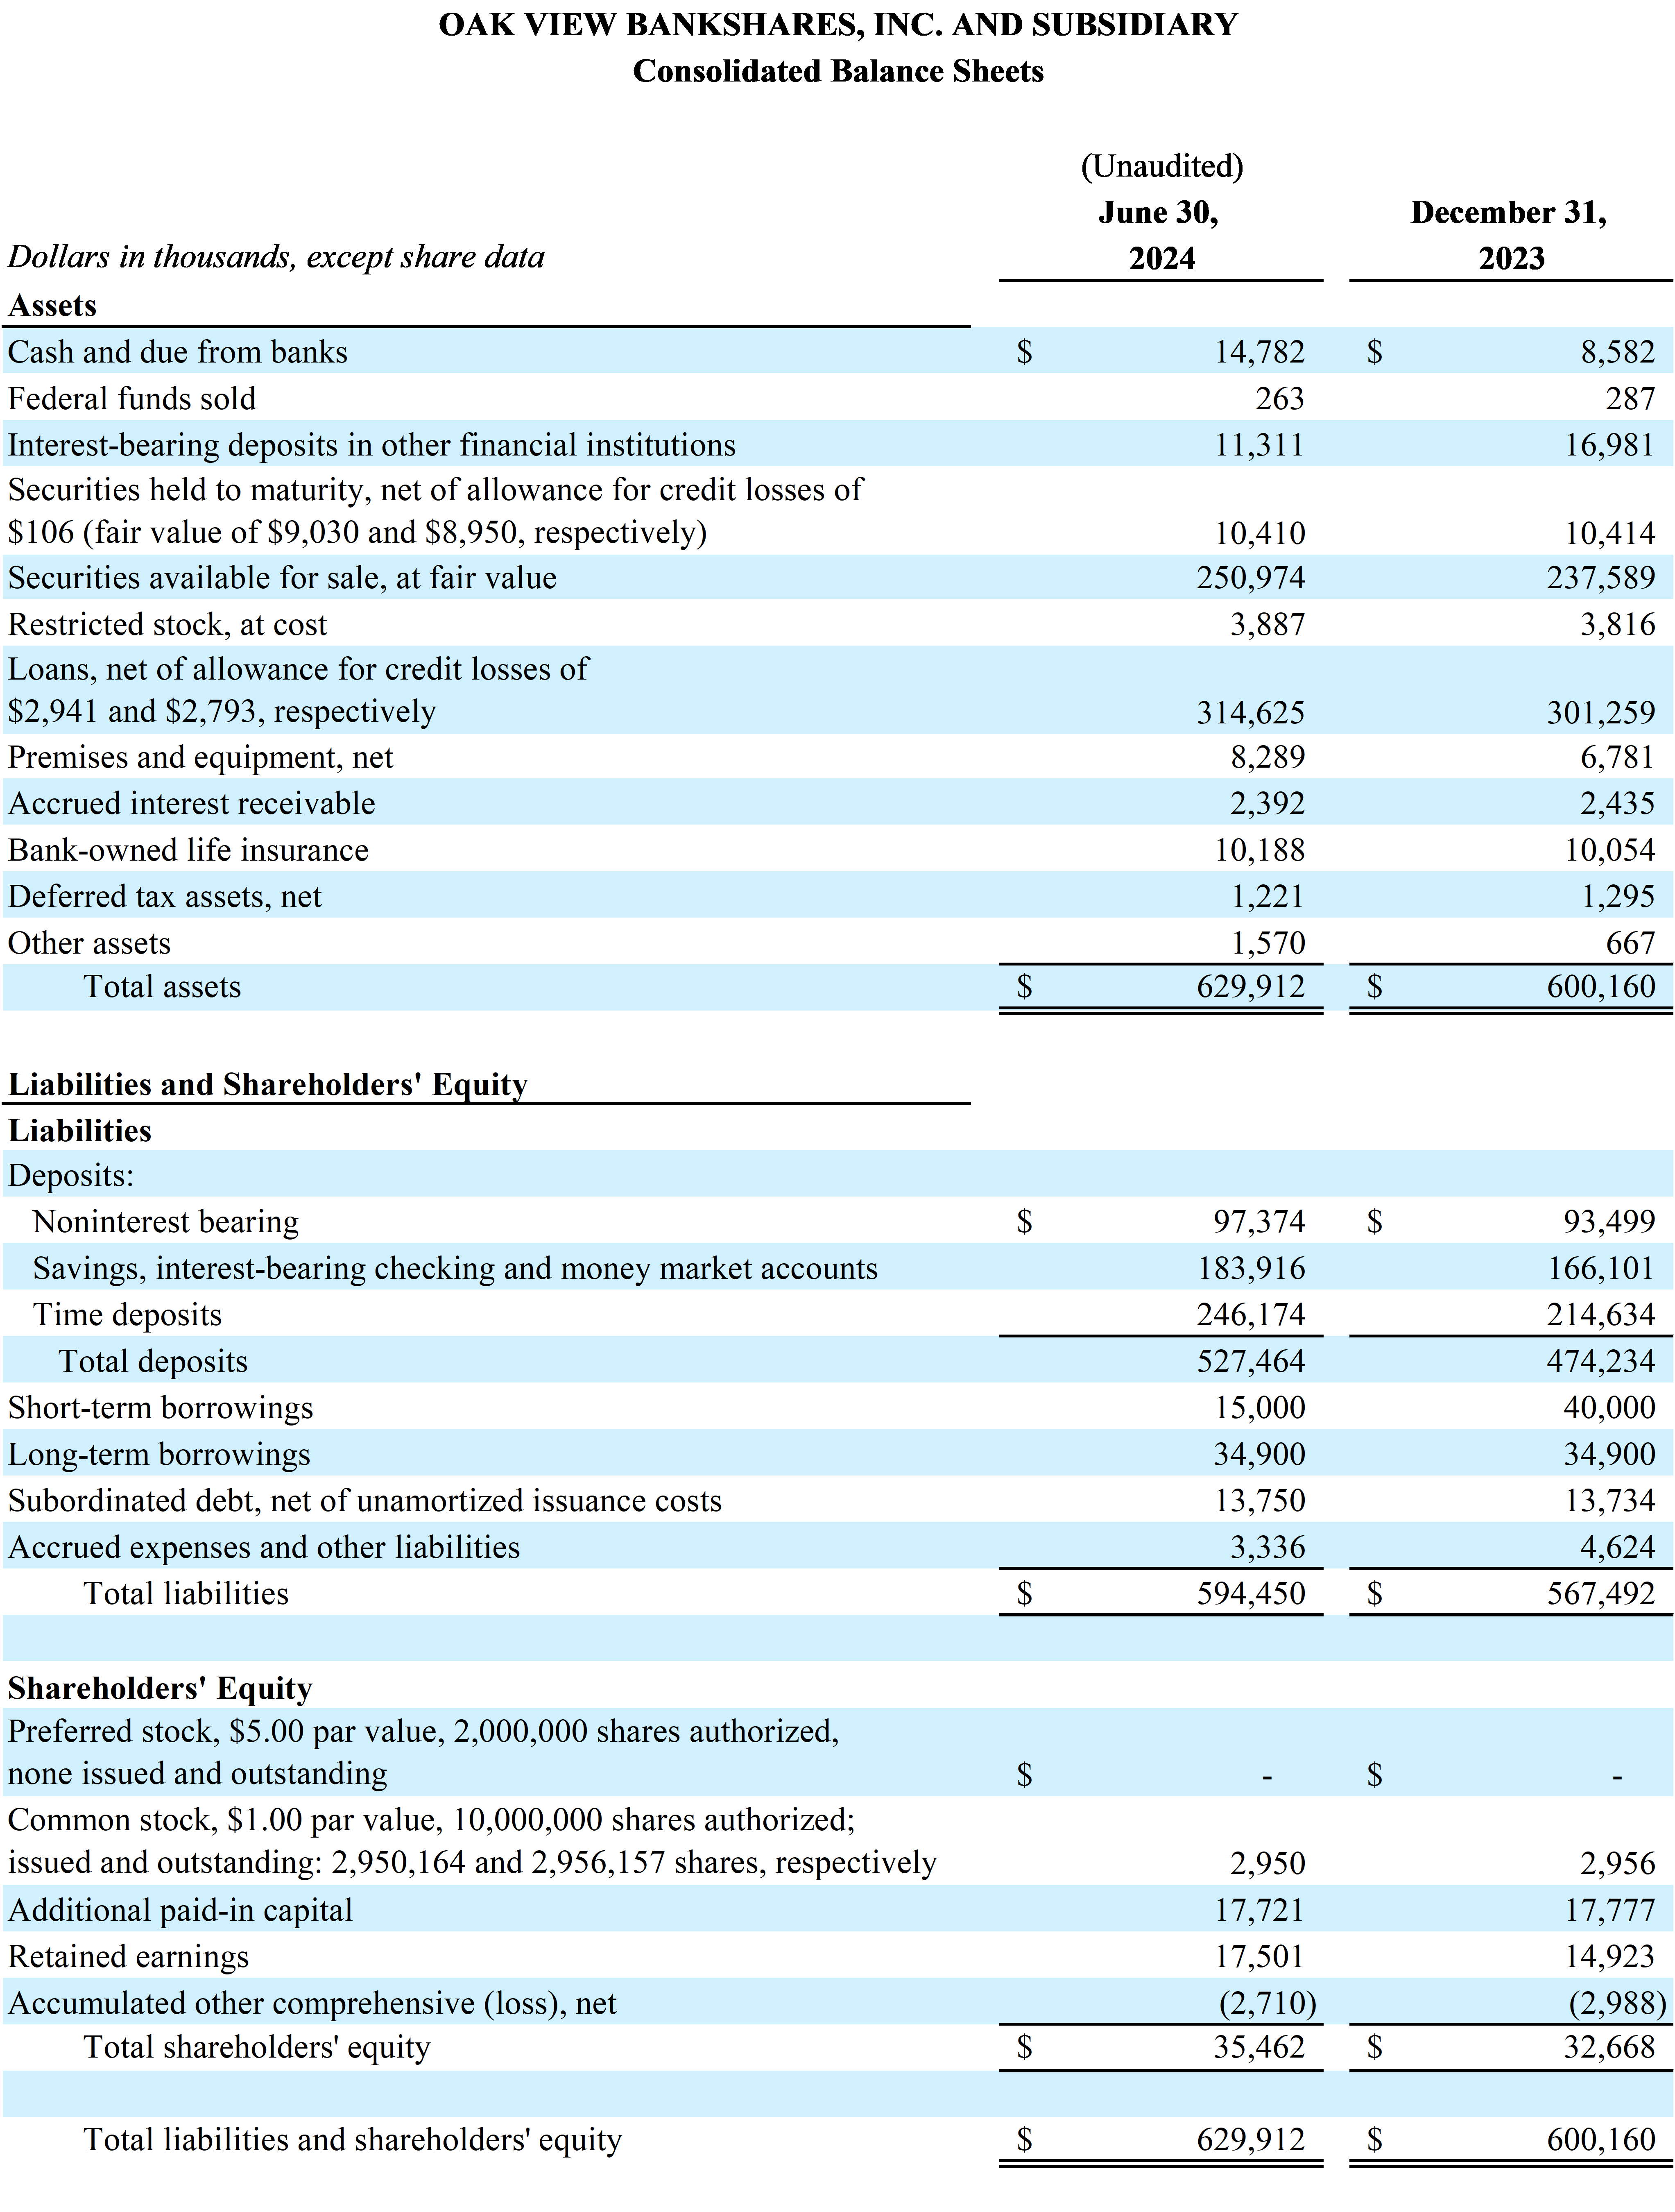 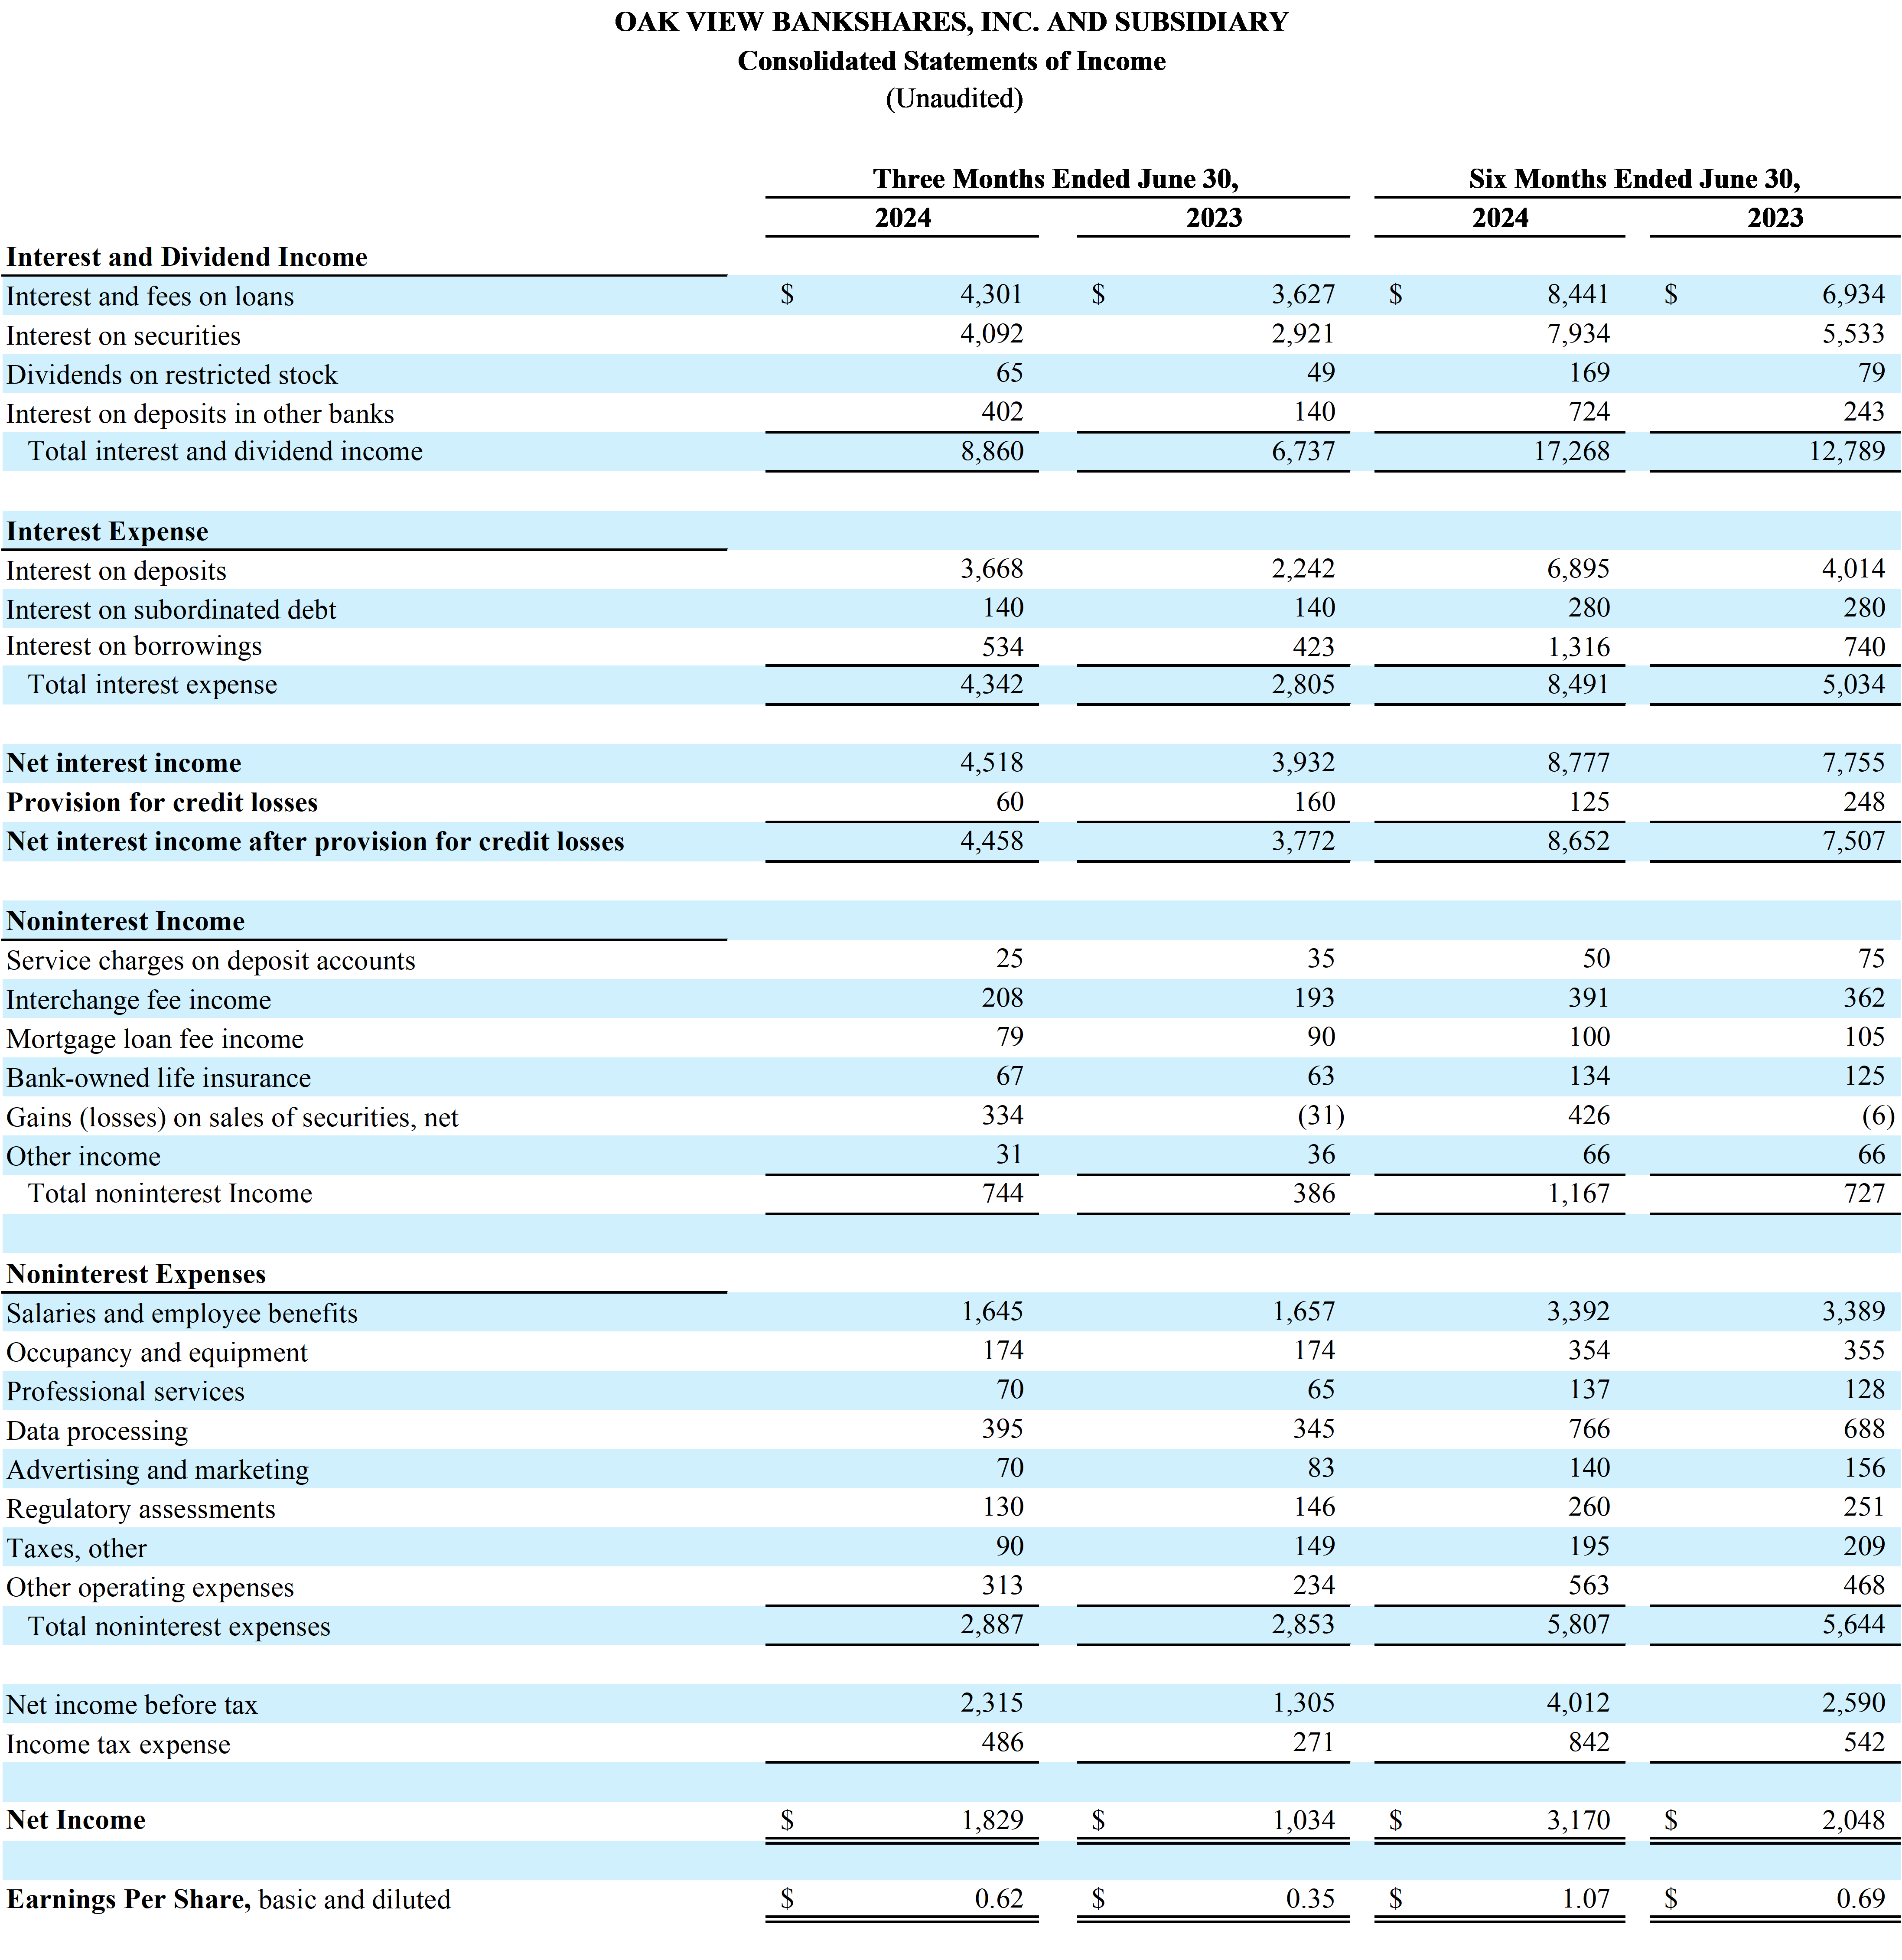 SOURCE: Oak View Bankshares, Inc. View the original press release on accesswire.com More NewsView More
3 Big Tech Stocks Sliding: What’s Behind the Drop? ↗
Today 8:11 EST

Wall Street Sees a Winner in Take-Two Stock. Should You? ↗
Today 7:29 EST
Via MarketBeat
Tickers
TTWO

Datavault AI Just Raised Guidance by 400%—Are You Paying Attention? ↗
November 20, 2025


Why Lithium Americas Could Be a 2030 Power Play—Not a 2025 One ↗
November 20, 2025
Via MarketBeat
Tickers
LAC
Recent QuotesView More
Stock Quote API & Stock News API supplied by www.cloudquote.io
Quotes delayed at least 20 minutes. By accessing this page, you agree to the Privacy Policy and Terms Of Service.
© 2025 FinancialContent. All rights reserved.
|