The QQQ ETF Points to What’s Next for Stocks… And You Probably Won’t Like the Answer
By:
Barchart.com
November 24, 2025 at 13:54 PM EST
If you can’t laugh at least a little on days like last Thursday, I can say this: It’s healthier than getting frustrated. I’m a risk manager, and that makes wild downward reversal days exciting for me. It also means I occasionally leave money on the table in up markets. So for me, Thursday’s laugh was when trading interrupted an article I started writing shortly after the market opened. The title: More Yield, Less Trap: Sign up free to get Barchart’s daily Dividend Investor newsletter straight to your inbox.
Nvidia’s big day rallies QQQ, but for how long? What the charts are telling me to do. Scientists talk about half-life. That headline was like a tenth of a life! Thursday started with what I consider an obligatory rally in the Invesco Nasdaq 100 ETF (QQQ). What else would we expect from a rally sparked by Nvidia’s (NVDA) strong quarterly results? But the rest of the day lived up to the would-be title. And it helps focus all traders on what might happen next for the QQQ, which is really the only index that should matter to market bulls. Most of the rest of the stock market, apart from earnings announcements, either rallies and drops with QQQ, or doesn’t rally much at all. This is not a new situation. It has been going on for years. Just consider a comparison between QQQ and an ETF that tracks the average S&P 500 Index ($SPX) stock. Until a few years ago, they would be considered close peers. Not anymore. Because the biggest stocks in the S&P 500 have risen to dominate the market cap-weighted Nasdaq-100 ($IUXX), which QQQ tracks. When the big get bigger, and bigger, and bigger, the average stock can’t keep up. In fact, it hasn’t done much at all for a while. This table tells the story succinctly. The Invesco S&P 500 Equal Weight ETF (RSP) had gained only 6.4% year to date through Wednesday’s close. That was only about one-third of QQQ’s gain for the year so far. 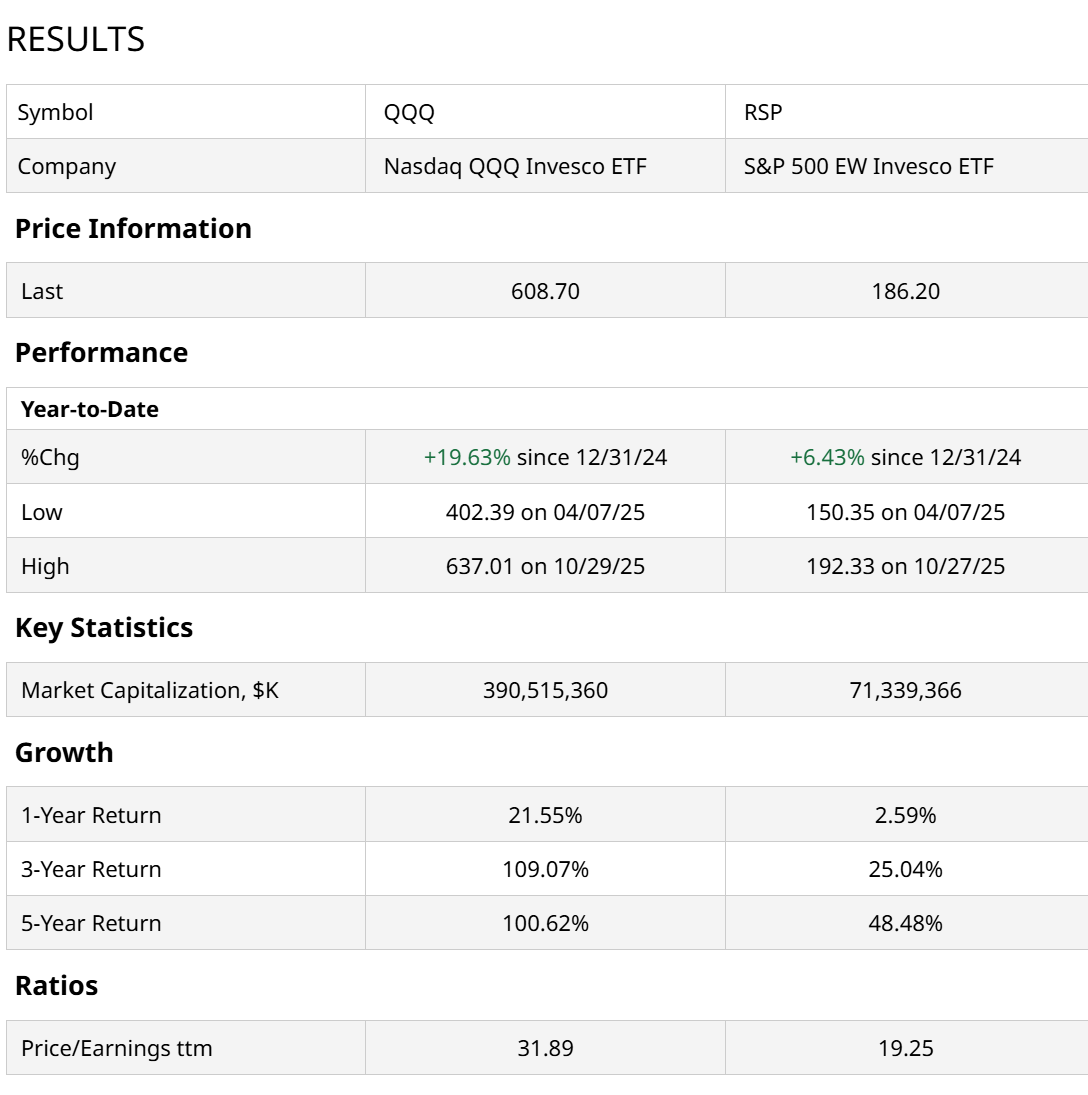 The further we look back, the more the gap widens between QQQ and RSP. Nearly 20% over the past 12 months, 84% over 3 years and a double over the past 5 years, with QQQ up 100% and RSP gaining less than half. So despite selling at a 40% P/E discount to QQQ, RSP is mired in a long slump. How does it mount a comeback? That’s a loaded question. There are two types of comebacks. The kind where RSP outperforms QQQ in an up market, which has not occurred in a while. And the type where RSP is “less bad” than QQQ in an overall down market. What Will the Stock Market Do From Here?The problem I see is this: Given the investment culture that has developed around QQQ this decade, I think the average stock is behind by a lot more than just the performance scoreboard. A generation of investors don’t care about most of the S&P 500. They care about the big winners and a smattering of up and comers in areas like AI, quantum computing, robotics and space. Toothpaste and machinery? Boring! That’s the attitude, and deeply discounted valuations might only go so far, even when the market temporarily turns on the Magnificent 7 stocks. Why the QQQ Chart Looks Exciting Right NowSometimes, we have to look at the charts and conclude the signal is not clear about where the key levels are. I think right now we have more clarity than usual. Because in the chart below, I see a more defined trading range than has been typical in recent months. 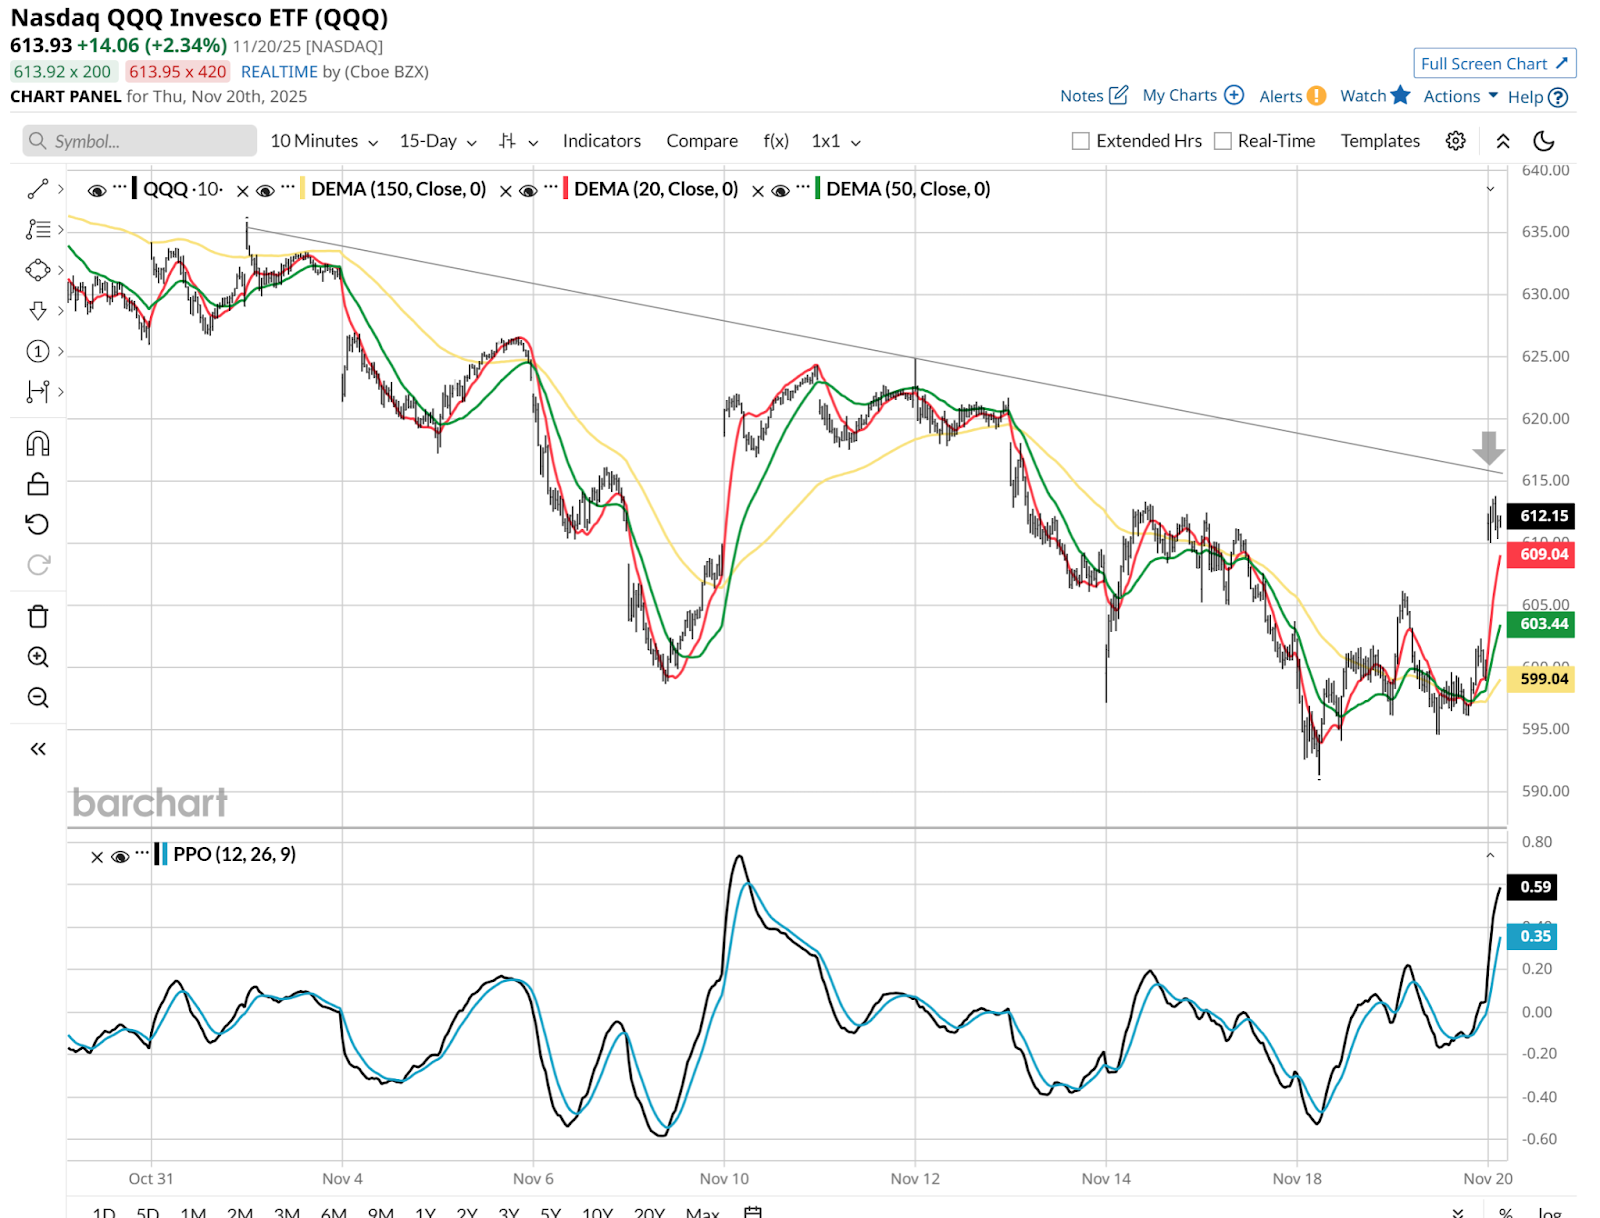 Above is a 10-minute chart and I pasted it into this article on Thursday morning, prior to the big intraday reversal. The timing is less important than the visual nature of this, since it can be applied to any stock or ETF at any time. I have drawn a trend line across the past two tops, which have led in recent weeks to a series of lower lows and lower highs. That defined the key area for QQQ to reach to break this downward trend. From the chart, that points to about $615, where I drew a grey, downward-pointing arrow. Sure, the market faded from this general area, but that was one day, Thursday. As I see it, until QQQ can break out firmly and sustainably above that $615 area, rallies are suspect. The hourly chart view confirms that same conclusion for me. I did not draw in the trendline down, nor the arrow, so as to allow you to visually train yourself to find those in this slightly longer-term look. 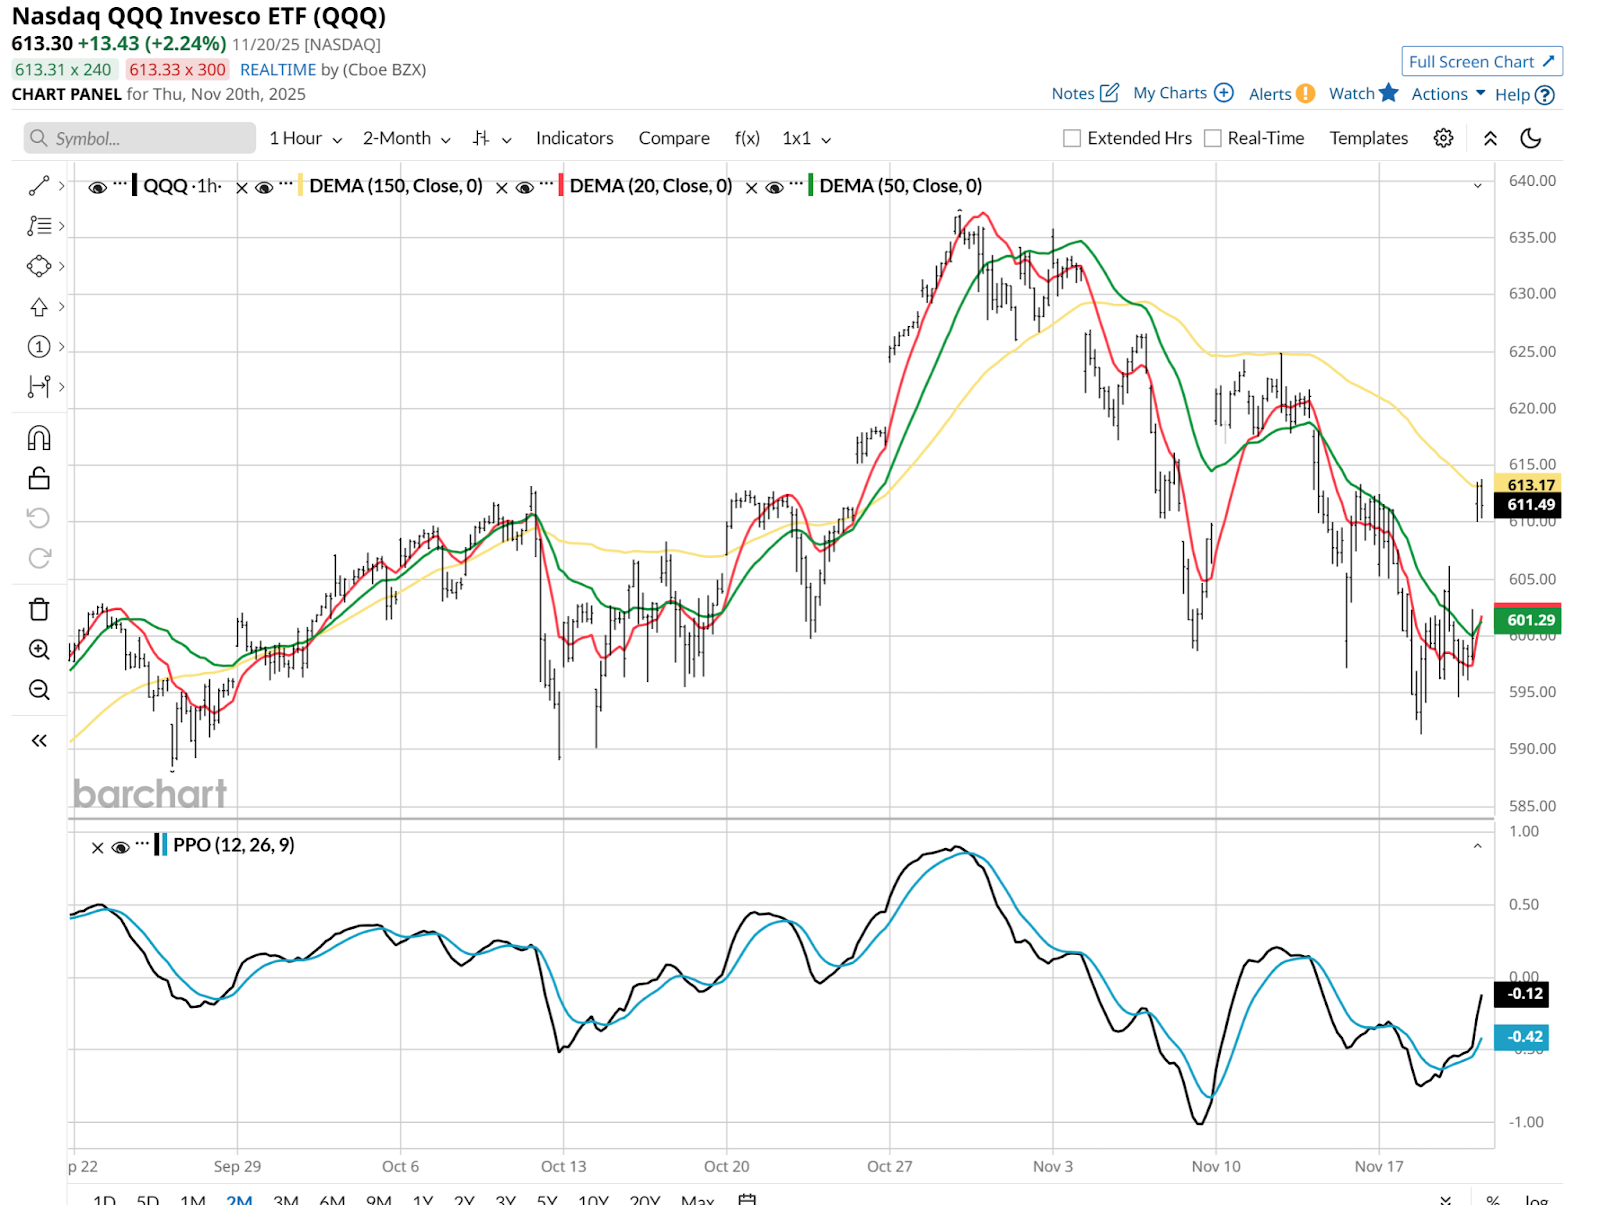 Finally, the more common daily chart is shown below. I see here a very risky market, thanks to a declining 20-day moving average, and a Percentage Price Oscillator (PPO) indicator at bottom which has just crossed into negative territory. 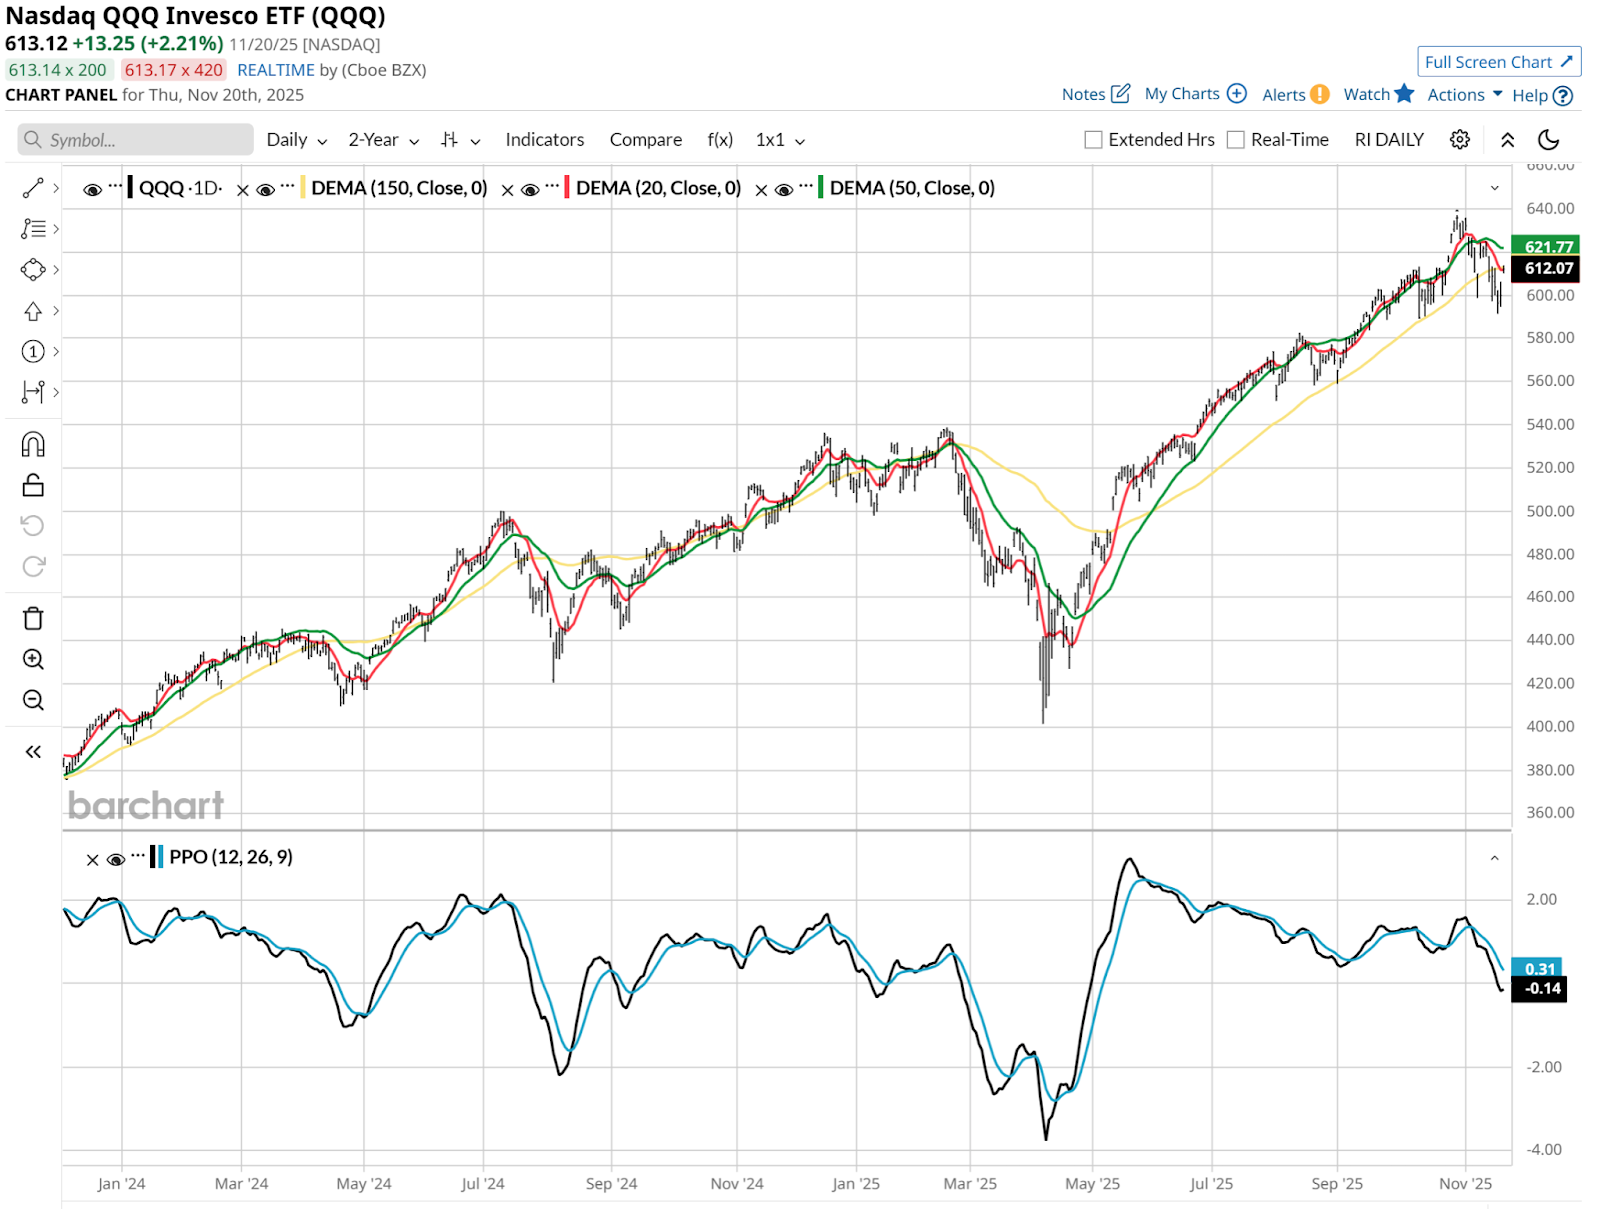 Think of those two indicators as akin to a car that was moving, slowed down, and is now looking to reverse direction. That’s what this market looks like it is doing. These things are never a given, but the evidence is growing. For those looking to try to capitalize on a continued QQQ fade or worse, inverse ETFs like the Proshares Short QQQ (PSQ) move opposite QQQ. There are leveraged ETFs both for bears and bulls as well. Traders would be wise to get familiar with them. On the date of publication, Rob Isbitts did not have (either directly or indirectly) positions in any of the securities mentioned in this article. All information and data in this article is solely for informational purposes. For more information please view the Barchart Disclosure Policy here.
More news from Barchart
More NewsView More
Why Taiwan Semiconductor's 6.5% Dip Could Be a Smart Buy ↗
December 16, 2025
Via MarketBeat

RTX Surges to Record Highs as Defense Orders Explode ↗
December 16, 2025
Via MarketBeat
Tickers
RTX

Smart Money Is Buying Auto Suppliers, Not Car Brands ↗
December 16, 2025

Higher Beef Prices Are Here: Best Steakhouse Stocks for 2026 ↗
December 16, 2025
Via MarketBeat

AI Runs on Power—And Constellation Energy Controls the Switch ↗
December 16, 2025
Recent QuotesView More
Stock Quote API & Stock News API supplied by www.cloudquote.io
Quotes delayed at least 20 minutes. By accessing this page, you agree to the Privacy Policy and Terms Of Service.
© 2025 FinancialContent. All rights reserved.
|