Sun Communities Reports 2024 Fourth Quarter and Full Year Results; Provides 2025 Guidance
By:
Sun Communities, Inc. via
GlobeNewswire
February 26, 2025 at 16:45 PM EST
Net Income / (Loss) per Diluted Share of $(1.77) and $0.71 for the Quarter and Full Year Core FFO per Share of $1.41 and $6.81 for the Quarter and Full Year North America Same Property NOI increased by 5.7% for the Quarter and North America Same Property Adjusted Blended Occupancy for MH and RV of 99.0% Expecting North American Same Property NOI Growth of 4.3% - 5.6% Expecting UK Same Property NOI Growth of 0.9% - 2.9% Southfield, Michigan, Feb. 26, 2025 (GLOBE NEWSWIRE) -- Sun Communities, Inc. (NYSE: SUI) (the "Company" or "SUI"), a real estate investment trust ("REIT") that owns and operates, or has an interest in, manufactured housing ("MH") and recreational vehicle ("RV") communities and marinas (collectively, the "properties"), today reported its fourth quarter and full year results for 2024. Financial Results for the Quarter and Year Ended December 31, 2024
Non-GAAP Financial Measures
"In the fourth quarter we continued to advance our strategic priorities focused on further simplifying our business," said Gary A. Shiffman, Chairman and CEO. "We achieved solid results in our Manufactured Housing segment, demonstrating the ongoing demand for attainable housing, while on the RV side we further increased the contribution from annual income streams. We are starting to see positive momentum with our operating initiatives and repositioning efforts aimed at maximizing revenue, diligent expense management, and more effective asset management to drive efficiencies. We have also been executing on our deleveraging initiative, disposing of approximately $570 million of non-strategic assets in 2024 and this year to date while remaining disciplined with capital investments. We took another meaningful step with the announcement of the sale of Safe Harbor Marinas, which will allow us to focus on our core businesses and further reduce our leverage. We are encouraged by our outlook for 2025 and our progress towards delivering sustained earnings growth." OPERATING HIGHLIGHTS North America Portfolio Occupancy
Same Property Results For the properties owned and operated by the Company since at least January 1, 2023, the following table reflects the percentage changes for the quarter and year ended December 31, 2024, as compared to the same periods in 2023:
North America Same Property adjusted blended occupancy for MH and RV increased by 160 basis points to 99.0% at December 31, 2024, from 97.4% at December 31, 2023. INVESTMENT ACTIVITY During the quarter ended December 31, 2024, the Company completed the following dispositions:
Net proceeds from the dispositions were used to pay off an aggregate of $44.3 million of borrowings under the Company's senior credit facility. Subsequent to the quarter ended December 31, 2024, the Company completed the following dispositions:
Refer to page 14 for additional details related to the Company's acquisition and disposition activity. Impacts of Hurricane Helene and Milton During the quarter ended December 31, 2024, the Company recognized charges of $13.9 million for debris removal and clean-up at several of its MH and RV properties and $4.4 million for impaired assets at several of its marinas due to the impact of Hurricane Helene and Milton. The Company maintains property, casualty, flood and business interruption insurance for its properties, subject to customary deductibles and limits. The foregoing impairment is based on current information available, and the Company continues to assess these estimates. The actual final impairment could vary significantly from these estimates. Any changes to these estimates will be recognized in the period(s) in which they are determined. BALANCE SHEET, CAPITAL MARKETS ACTIVITY AND OTHER ITEMS As of December 31, 2024, the Company had $7.4 billion in debt outstanding with a weighted average interest rate of 4.1% and a weighted average maturity of 6.2 years. At December 31, 2024, the Company's Net Debt to trailing twelve-month Recurring EBITDA ratio was 6.0 times. UK Goodwill Impairment During the quarter ended December 31, 2024, the Company recorded a non-cash goodwill impairment charge of $180.8 million in the Park Holidays reporting unit within the UK segment as part of its annual quantitative testing of goodwill. The decline in the fair value of the reporting unit was driven by recent uncertainty in the macroeconomic environment in the region, including higher borrowing costs and changing market dynamics, resulting in a decline in projected future cash flows. Safe Harbor Sale Subsequent to the quarter ended December 31, 2024, the Company announced that it had entered into an agreement to sell 100% of the Company's interest in the Safe Harbor Marinas business for an all-cash purchase price of $5.65 billion, subject to certain post-closing adjustments (the "Safe Harbor Sale"). While the Safe Harbor Sale is anticipated to close in the second quarter of 2025, the Safe Harbor Sale is subject to certain closing conditions and rights of termination, and it may not be completed on the anticipated timeline or at all. The Safe Harbor Sale is expected to generate approximately $5.5 billion of pre-tax proceeds after transaction costs, which the Company expects to use to support a combination of debt reduction, distributions to shareholders, and reinvestment in the Company's core businesses. The Safe Harbor Sale represents the disposition of the Company's Marina reporting segment and a strategic shift in operations. Accordingly, the historical results of the Marina reporting segment and assets and liabilities included in the disposition will be presented in the Company's consolidated financial statements as held for sale and as discontinued operations beginning in the first quarter of 2025. The initial closing of the Safe Harbor Sale is expected to take place during the second quarter of 2025. Upon closing, the Company expects to realize an estimated gain on sale of approximately $1.3 billion within Income from discontinued operations, net on the Company's Consolidated Statement of Operations. Certain marina properties representing approximately 10% of the total consideration may be transferred and paid for in one or more subsequent closings, subject to receipt of certain third-party approvals. 2025 GUIDANCE The Company is establishing first quarter and full year 2025 guidance for Diluted EPS attributable to the Consolidated Portfolio (excluding marinas) and Core FFO per Share attributable to the Consolidated Portfolio (excluding marinas). The Company's guidance presented in this earnings release does not give pro forma effect to the completion of the Safe Harbor Sale, nor does it reflect any impacts therefrom, including timing and potential uses of proceeds. While the Safe Harbor Sale is anticipated to close in the second quarter of 2025, the Safe Harbor Sale is subject to certain closing conditions and rights of termination, and it may not be completed on the anticipated timeline or at all. Pursuant to the terms of the transaction agreement governing the Safe Harbor Sale, certain properties are also subject to the receipt of certain third-party consents and other closing conditions that may cause those properties to be sold in one or more subsequent closings, or may not be sold at all. In addition, while the Company currently anticipates that the proceeds from the Safe Harbor Sale will be used to support a combination of debt paydown, distributions to shareholders and reinvestment in the Company's core businesses, the anticipated proceeds are subject to adjustment, and no final decisions have been made with respect to use thereof. For these reasons, as well as other factors described elsewhere in this earnings release and in the Company's public reports, the actual results from the Company's business and operations in such period may differ materially from the Company's guidance for that period. Given uncertainties related to the operations and financial impact to the Company of its marina portfolio during the pendency of the Safe Harbor Sale, including with respect to its operations prior to closing, the timing of closing and the impacts to the Company thereof, and the potential of subsequent closings and the timing thereof, the Company is not providing guidance with respect to the marina portfolio at this time. The Company expects to provide updated guidance following the closing of the Safe Harbor Sale.
(a) Excludes results from the Company’s marina portfolio. The historical earnings attributable to the marina portfolio were $11.2 million for the first quarter 2024, and $74.2 million for the full year 2024. The historical Core FFO attributable to the marina portfolio was $46.9 million for the first quarter 2024, and $266.3 million for the full year 2024. The historical results of the marina portfolio may be materially different from the results of the marina portfolio for any future period. For illustrative purposes only, if these amounts were combined with our Consolidated Portfolio (excluding marinas) guidance stated above, it would imply a first quarter and full year 2025 combined EPS guidance range of between $(0.19) and $(0.11), and between $1.70 and $1.94, respectively, and a first quarter and full year 2025 combined Core FFO guidance range of between $1.14 and $1.22, and between $6.82 and $7.06, respectively. The historical results of the marina portfolio may be materially different from the results of the marina portfolio for any future period, and, given the inherent uncertainties related to the operations and financial impact to the Company of its marina portfolio during the pendency of the Safe Harbor Sale, investors are encouraged not to place undue reliance upon such amounts. (b) The diluted share counts for the quarter ending March 31, 2025 and the year ending December 31, 2025 are estimated to be 132.4 million and 132.5 million, respectively. (c) No reconciliation of the forecasted range for Core FFO per share attributable to the Consolidated Portfolio (excluding marinas) is included in this release because we are unable to quantify certain amounts that would be required to be included in the reconciliation to the comparable GAAP financial measure without unreasonable efforts, particularly with respect to the allocations of itemized adjustments to the Consolidated Portfolio (excluding marinas) during the pendency of the Safe Harbor Sale, and we believe such reconciliation would imply a degree of precision that could be confusing or misleading to investors. (d) The Company's guidance translates forecasted results from operations in the UK using the relevant exchange rate provided in the table presented below. The impact of fluctuations in Canadian and Australian foreign currency rates on guidance are not material.
Supplemental Guidance Tables:
For the first quarter ending March 31, 2025, the Company's guidance range assumes North America Same Property NOI growth of 3.0% - 4.3% and UK Same Property NOI growth of (5.4%) - (2.6%).
The estimates and assumptions presented above represent a range of possible outcomes and may differ materially from actual results. These estimates include contributions from all acquisitions, dispositions and capital markets activity completed through February 26, 2025. These estimates exclude all other prospective acquisitions, dispositions and capital markets activity, including the Safe Harbor Sale. The estimates and assumptions are forward-looking based on the Company's current assessment of economic and market conditions and are subject to the other risks outlined below under the caption Cautionary Statement Regarding Forward-Looking Statements. EARNINGS CONFERENCE CALL A conference call to discuss fourth quarter results will be held on Thursday, February 27, 2025 at 2:00 P.M. (ET). To participate, call toll-free at (877) 407-9039. Callers outside the U.S. or Canada can access the call at (201) 689-8470. A replay will be available following the call through March 13, 2025 and can be accessed toll-free by calling (844) 512-2921 or (412) 317-6671. The Conference ID number for the call and the replay is 13751363. The conference call will be available live on the Company's website located at www.suninc.com. The replay will also be available on the website. CAUTIONARY STATEMENT REGARDING FORWARD-LOOKING STATEMENTS This press release contains various "forward-looking statements" within the meaning of the Securities Act of 1933, as amended (the "Securities Act"), and the Securities Exchange Act of 1934, as amended (the "Exchange Act"), and the Company intends that such forward-looking statements will be subject to the safe harbors created thereby. For this purpose, any statements contained in this document that relate to expectations, beliefs, projections, future plans and strategies, trends or prospective events or developments and similar expressions concerning matters that are not historical facts are deemed to be forward-looking statements. Words such as "forecasts," "intend," "goal," "estimate," "expect," "project," "projections," "plans," "predicts," "potential," "seeks," "anticipates," "should," "could," "may," "will," "designed to," "foreseeable future," "believe," "scheduled," "guidance," "target" and similar expressions are intended to identify forward-looking statements, although not all forward-looking statements contain these words. These forward-looking statements reflect the Company's current views with respect to future events and financial performance, but involve known and unknown risks and uncertainties, both general and specific to the matters discussed in this document, some of which are beyond the Company's control. These risks and uncertainties and other factors may cause the Company's actual results to be materially different from any future results expressed or implied by such forward-looking statements. In addition to the risks described under "Risk Factors" contained in the Company's Annual Report on Form 10-K for the year ended December 31, 2023, and in the Company's other filings with the Securities and Exchange Commission, from time to time, such risks, uncertainties and other factors include, but are not limited to:
Readers are cautioned not to place undue reliance on these forward-looking statements, which speak only as of the date the statement was made. The Company undertakes no obligation to publicly update or revise any forward-looking statements included or incorporated by reference into this document, whether as a result of new information, future events, changes in the Company's expectations or otherwise, except as required by law. Although the Company believes that the expectations reflected in the forward-looking statements are reasonable, the Company cannot guarantee future results, levels of activity, performance or achievements. All written and oral forward-looking statements attributable to the Company or persons acting on the Company's behalf are qualified in their entirety by these cautionary statements. Company Overview and Investor Information The Company Established in 1975, Sun Communities, Inc. became a publicly owned corporation in December 1993. The Company is a fully integrated REIT listed on the New York Stock Exchange under the symbol: SUI. As of December 31, 2024, the Company owned, operated, or had an interest in a portfolio of 645 developed MH, RV, Marina, and UK properties comprising approximately 176,390 developed sites and approximately 48,760 wet slips and dry storage spaces in the U.S., Canada and the U.K. For more information about the Company, please visit www.suninc.com.
Financial and Operating Highlights
(a) Reflects restated financial information for non-cash goodwill impairment charges. Portfolio Overview as of December 31, 2024
Consolidated Balance Sheets
(a) Refer to "Secured borrowings on collateralized receivables" within Definitions and Notes for additional information. Consolidated Statements of Operations
(a) Refer to "Utility Revenues" within Definitions and Notes for additional information. Reconciliation of Net Income / (Loss) Attributable to SUI Common Shareholders to Core FFO
(a) Refer to Definitions and Notes for additional information.
(c) Excludes the effect of certain anti-dilutive convertible securities. Reconciliation of Net Income / (Loss) Attributable to SUI Common Shareholders to NOI
(a) Refer to Definitions and Notes for additional information. Reconciliation of Net Income / (Loss) Attributable to SUI Common Shareholders to Recurring EBITDA
(a) Refer to Definitions and Notes for additional information. Real Property Operations - Total Portfolio
N/M = Not meaningful. N/A = Not applicable. (b) Refer to Definitions and Notes for additional information. Real Property Operations - North America Same Property Portfolio(a)
(a) Refer to Definitions and Notes for additional information. (b) Same Property results for the Company's MH and RV properties reflect constant currency for comparative purposes. Canadian currency figures in the prior comparative period have been translated at the average exchange rate of $0.7148 and $0.7302 USD per Canadian dollar, respectively, during the quarter and year ended December 31, 2024. (c) Financial results from properties impacted by dispositions and catastrophic weather events during 2024 have been removed from Same Property reporting. (d) Percentages are calculated based on unrounded numbers. (e) Refer to "Utility Revenues" within Definitions and Notes for additional information. Real Property Operations - North America Same Property Portfolio(a) (Continued) (e) Total Same Property operating expenses consist of the following components for the periods shown (in millions) and exclude amounts invested into recently acquired properties to bring them up to the Company's standards:
N/A = Not applicable. (a) Refer to Definitions and Notes for additional information. (b) Financial results from properties impacted by dispositions and catastrophic weather events during 2024 have been removed from Same Property reporting. (c) Same Property blended occupancy for MH and RV was 98.2% at December 31, 2024, up 40 basis points from 97.8% at December 31, 2023. Adjusting for recently delivered and vacant expansion sites, Same Property adjusted blended occupancy for MH and RV increased by 160 basis points year over year, to 99.0% at December 31, 2024, from 97.4% at December 31, 2023. (d) Calculated using actual results without rounding. (e) Occupied rental program sites in Same Property are included in total sites. Real Property Operations - UK Same Property Portfolio(a)
(a) Refer to Definitions and Notes for additional information. (b) Same Property results for the Company's UK properties reflect constant currency for comparative purposes. British pound sterling figures in the prior comparative period have been translated at the average exchange rate of $1.2817 USD and $1.2781 USD per Pound sterling, respectively, during the quarter and year ended December 31, 2024. (c) Percentages are calculated based on unrounded numbers. (d) Refer to "Utility Revenues" within Definitions and Notes for additional information. (e) Adjusting for recently delivered and vacant expansion sites, Same Property adjusted occupancy decreased by 50 basis points year over year, to 89.9% at December 31, 2024, from 90.4% at December 31, 2023. Home Sales Summary
(a) Refer to Definitions and Notes for additional information. Operating Statistics for MH and Annual RVs
(a) Increase in revenue producing sites, net of new vacancies. Acquisitions and Dispositions
(a) Acquired via ground lease agreement. (b) In conjunction with this acquisition, the Company issued 19,326 common OP units valued at $2.5 million. (c) Combined with an existing property. (d) In conjunction with this acquisition, the Company issued 243,273 common OP units valued at $31.5 million. (e) Total sales proceeds include the disposition of four properties that were owned by the Company along with the settlement of a developer note receivable of $33.9 million pertaining to three additional properties in which the Company had provided financing to the developer. Capital Expenditures and Investments
N/A = Not applicable. (a) Refer to Definitions and Notes for additional information. (b) Average based on actual number of MH and RV sites, Marina wet slips and dry storage spaces, and UK sites associated with the recurring capital expenditures in each period. Capitalization Overview
(a) Refer to "Securities" within Definitions and Notes for additional information related to the Company's securities outstanding. (b) Refer to "Enterprise Value" within Definitions and Notes for additional information. (c) Refer to "Secured borrowings on collateralized receivables" within Definitions and Notes for additional information. Summary of Outstanding Debt (amounts in millions, except for *)
(a) Includes the effect of amortizing deferred financing costs, loan premiums / discounts, and derivatives, as well as fair value adjustments on the Secured borrowings on collateralized receivables. (b) Refer to "Secured borrowings on collateralized receivables" within Definitions and Notes for additional information. (c) As of December 31, 2024, the Company's revolving credit facilities consisted of:
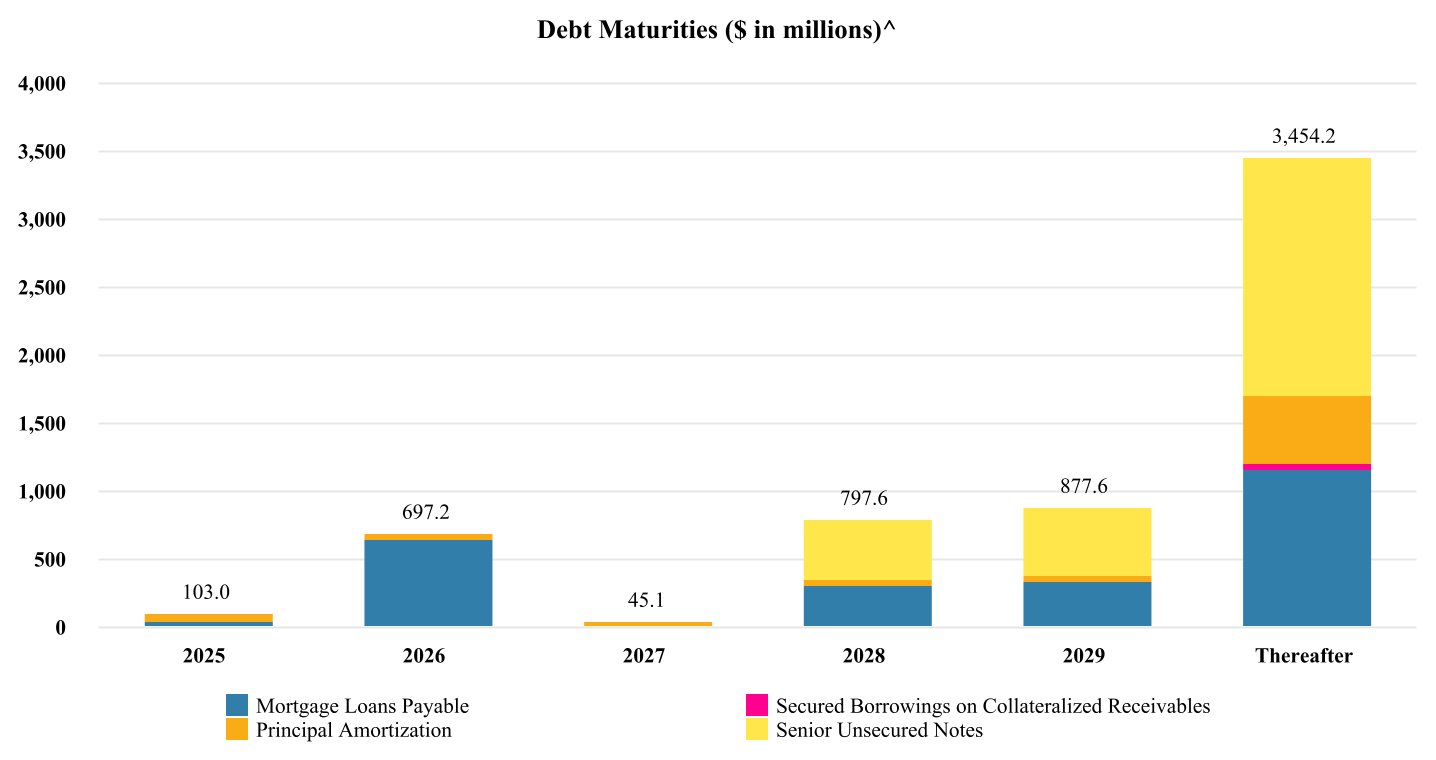
Debt Maturities(a) (amounts in millions, except for *)
(a) Debt maturities include the unamortized deferred financing costs, discount / premiums, and fair value adjustments associated with outstanding debt. (b) For the Mortgage loans payable maturing between 2025 - 2029:
(c) Balance at December 31, 2024 excludes fair value adjustments of $3.9 million. (d) Refer to "Secured borrowings on collateralized receivables" within Definitions and Notes for additional information. (e) Represents the initial maturity for the revolving loan facility. The Company holds the unilateral option to extend the maturity date for two additional six-month periods to April 7, 2027.
^ Excludes the Company's borrowings under its senior credit facility. Debt Analysis
(a) Refer to Definition and Notes for additional information. (b) Percentage includes the impact of hedge activities. Definitions and Notes Acquisition and Other Transaction Costs - In the Company's Reconciliation of Net Income / (Loss) Attributable to SUI Common Shareholders to Core FFO on page 6, 'Acquisition and other transaction costs' represent (a) nonrecurring integration expenses associated with acquisitions during the quarter and years ended December 31, 2024 and 2023, (b) costs associated with potential acquisitions that will not close, (c) expenses incurred to bring recently acquired properties up to the Company's operating standards, including items such as tree trimming and painting costs that do not meet the Company's capitalization policy, and other non-recurring transaction costs, and (d) other non-recurring transactions. Asset Impairments - In the Company's Consolidated Statement of Operations on page 5, the Company recorded asset impairment charges during the quarter ended December 31, 2024, which primarily consisted of aggregate charges of $24.1 million in the MH and RV segments related to non-continuing expansion and development projects and related assets, as well as charges of $12.1 million related to four RV properties that were reclassified as held for sale as of December 31, 2024, and subsequently sold in January 2025. Capital Expenditures and Investment Activity - The Company classifies its investments in properties into the following categories:
Capital improvements subsequent to acquisition often require 24 to 36 months to complete after closing. At MH, RV and UK properties, capital improvements include upgrading clubhouses; landscaping; new street lighting systems; new mail delivery systems; pool renovations including larger decks, heaters and furniture; new maintenance facilities; lot modifications; and new signage including main signs and internal road signs. Capital improvements at Marina properties primarily include improvements to rooms, renovation of restaurant facilities, pools and fitness centers. For the year ended December 31, 2024, the components of total acquisition investment are as follows (in millions):
(a) Includes the value allocated to infrastructure improvements associated with acquired land, when applicable.
Enterprise Value - Equals total equity market capitalization, plus total indebtedness reported on the Company's balance sheet and less unrestricted cash and cash equivalents. GAAP - U.S. Generally Accepted Accounting Principles. Home Sales Contribution to FFO - The reconciliation of NOI from home sales to FFO from home sales for the quarter and year ended December 31, 2024 is as follows (in millions):
Interest expense - The following is a summary of the components of the Company's interest expense (in millions):
NAREIT - The National Association of Real Estate Investment Trusts is the worldwide representative voice for REITs and real estate companies with an interest in U.S. real estate and capital markets. More information is available at www.reit.com. Net Debt - The carrying value of debt, plus, unamortized premiums, discounts and deferred financing costs, less unrestricted cash and cash equivalents. Other adjustments, net - In the Company's Reconciliation of Net Income / (Loss) Attributable to SUI Common Shareholders to Core FFO on page 6, Other adjustments, net consists of the following (in millions):
Other income / (expense), net - In the Company's Consolidated Statements of Operations on page 5, Other income / (expense), net consists of the following (in millions):
Same Property - The Company defines Same Properties as those the Company has owned and operated continuously since at least January 1, 2023. Same properties exclude ground-up development properties, acquired properties and properties sold after December 31, 2022. The Same Property data may change from time-to-time depending on acquisitions, dispositions, management discretion, significant transactions or unique situations. Secured borrowings on collateralized receivables - This is a transferred asset transaction which has been classified as collateralized receivables and the cash received from this transaction has been classified as secured borrowings. The interest income and interest expense accrue at the same amount. The Company has elected to record the collateralized receivables and secured borrowings at fair value under ASC 820, "Fair Value Measurements and Disclosures." As a result, the balance of collateralized receivables and related secured borrowings are net of fair value adjustments. Securities - The Company had the following securities outstanding as of December 31, 2024:
(a) Exchange rates are subject to adjustment upon stock splits, recapitalizations and similar events. The exchange rates of certain series of OP units are approximated to four decimal places. (b) Calculation may yield minor differences due to fractional shares paid in cash to the shareholder at conversion. (c) Annual distribution is based on the last quarterly distribution annualized. Share - In addition to reporting net income on a diluted basis ("EPS"), the Company reports FFO and Core FFO on a per common share and dilutive convertible securities basis (per "Share"). For the periods presented below, the Company's diluted weighted average common shares outstanding for EPS and FFO are as follows:
Utility Revenues - In its Consolidated Statements of Operations and its total portfolio presentation of real property operating results, the Company includes the following utility reimbursement revenues in real property revenues (excluding transient):
For its presentation of Same Property results on page 10 and page 12, the Company nets the following utility revenues (which include utility reimbursement revenues from residents) against related utility expenses in Same Property operating expenses:
Non-GAAP Supplemental Measures Investors and analysts following the real estate industry use non-GAAP supplemental performance measures, including net operating income ("NOI"), earnings before interest, tax, depreciation and amortization ("EBITDA") and funds from operations ("FFO") to assess REITs. The Company believes that NOI, EBITDA and FFO are appropriate measures given their wide use by and relevance to investors and analysts. Additionally, NOI, EBITDA and FFO are commonly used in various ratios, pricing multiples, yields and returns and valuation calculations used to measure financial position, performance and value. NOI provides a measure of rental operations that does not factor in depreciation, amortization and non-property specific expenses such as general and administrative expenses. EBITDA provides a further measure to evaluate the Company's ability to incur and service debt; EBITDA also provides further measures to evaluate the Company's ability to fund dividends and other cash needs. FFO, reflecting the assumption that real estate values rise or fall with market conditions, principally adjusts for the effects of GAAP depreciation and amortization of real estate assets.
The Company believes that GAAP net income (loss) is the most directly comparable measure to NOI. NOI should not be considered to be an alternative to GAAP net income (loss) as an indication of the Company's financial performance or GAAP net cash provided by operating activities as a measure of the Company's liquidity; nor is it indicative of funds available for the Company's cash needs, including its ability to make cash distributions. Because of the inclusion of items such as interest, depreciation and amortization, the use of GAAP net income (loss) as a performance measure is limited as these items may not accurately reflect the actual change in market value of a property, in the case of depreciation and in the case of interest, may not necessarily be linked to the operating performance of a real estate asset, as it is often incurred at a parent company level and not at a property level.
Attachment 
More NewsView More
Market Momentum: 3 Stocks Poised for Major Breakouts ↗
December 10, 2025
Via MarketBeat
3 Reasons Casey’s General Stores Will Continue Trending Higher ↗
December 10, 2025
Via MarketBeat
Tickers
CASY

Golden Cross Alert: 3 Stocks With Major Upside Potential ↗
December 10, 2025

The Top 3 Investment Themes That Will Dominate 2026 ↗
December 10, 2025

Vertical’s Valo Launch: A Commercial Leap Disguised as a Dip ↗
December 10, 2025
Via MarketBeat
Recent QuotesView More
Stock Quote API & Stock News API supplied by www.cloudquote.io
Quotes delayed at least 20 minutes. By accessing this page, you agree to the Privacy Policy and Terms Of Service.
© 2025 FinancialContent. All rights reserved.
| |||||||||||||||||||||||||||||||||||||||||||||||||||||||||||||||||||||||||||||||||||||||||||||||||||||||||||||||||||||||||||||||||||||||||||||||||||||||||||||||||||||||||||||||||||||||||||||||||||||||||||||||||||||||||||||||||||||||||||||||||||||||||||||||||||||||||||||||||||||||||||||||||||||||||||||||||||||||||||||||||||||||||||||||||||||||||||||||||||||||||||||||||||||||||||||||||||||||||||||||||||||||||||||||||||||||||||||||||||||||||||||||||||||||||||||||||||||||||||||||||||||||||||||||||||||||||||||||||||||||||||||||||||||||||||||||||||||||||||||||||||||||||||||||||||||||||||||||||||||||||||||||||||||||||||||||||||||||||||||||||||||||||||||||||||||||||||||||||||||||||||||||||||||||||||||||||||||||||||||||||||||||||||||||||||||||||||||||||||||||||||||||||||||||||||||||||||||||||||||||||||||||||||||||||||||||||||||||||||||||||||||||||||||||||||||||||||||||||||||||||||||||||||||||||||||||||||||||||||||||||||||||||||||||||||||||||||||||||||||||||||||||||||||||||||||||||||||||||||||||