
Plastic packaging and engineered materials manufacturer Berry Global Group (NYSE:BERY) reported Q3 CY2024 results beating Wall Street’s revenue expectations, with sales up 2.6% year on year to $3.17 billion. Its non-GAAP profit of $2.27 per share was 1% above analysts’ consensus estimates.
Is now the time to buy Berry Global Group? Find out by accessing our full research report, it’s free.
Berry Global Group (BERY) Q3 CY2024 Highlights:
- Revenue: $3.17 billion vs analyst estimates of $3.13 billion (2.6% year-on-year growth, 1.1% beat)
- Adjusted EPS: $2.27 vs analyst estimates of $2.25 (1% beat)
- Adjusted EBITDA: $546 million vs analyst estimates of $560.2 million (17.2% margin, 2.5% miss)
- Adjusted EPS guidance for the upcoming financial year 2025 is $6.35 at the midpoint, missing analyst estimates by 22.6%
- Operating Margin: 8.5%, down from 9.8% in the same quarter last year
- Free Cash Flow Margin: 32.5%, similar to the same quarter last year
- Market Capitalization: $7.68 billion
Company Overview
Founded as Imperial Plastics, Berry Global (NYSE: BERY) is a manufacturer and marketer of plastic packaging products, including containers, bottles, and prescription packaging.
Industrial Packaging
Industrial packaging companies have built competitive advantages from economies of scale that lead to advantaged purchasing and capital investments that are difficult and expensive to replicate. Recently, eco-friendly packaging and conservation are driving customers preferences and innovation. For example, plastic is not as desirable a material as it once was. Despite being integral to consumer goods ranging from beer to toothpaste to laundry detergent, these companies are still at the whim of the macro, especially consumer health and consumer willingness to spend.
Sales Growth
A company’s long-term performance is an indicator of its overall quality. While any business can experience short-term success, top-performing ones enjoy sustained growth for multiple years. Regrettably, Berry Global Group’s sales grew at a mediocre 6.7% compounded annual growth rate over the last five years. This fell short of our benchmark for the industrials sector and is a poor baseline for our analysis.
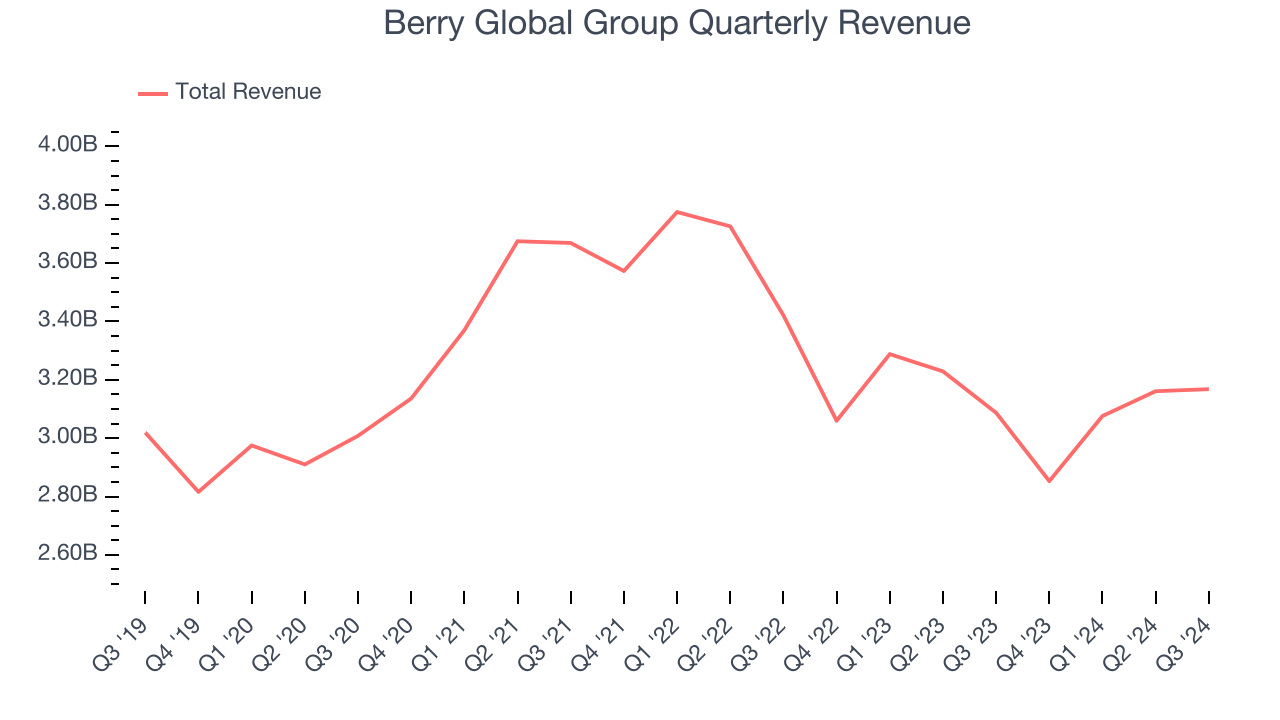
We at StockStory place the most emphasis on long-term growth, but within industrials, a half-decade historical view may miss cycles, industry trends, or a company capitalizing on catalysts such as a new contract win or a successful product line. Berry Global Group’s history shows it grew in the past but relinquished its gains over the last two years, as its revenue fell by 8% annually. Berry Global Group isn’t alone in its struggles as the Industrial Packaging industry experienced a cyclical downturn, with many similar businesses seeing lower sales at this time. 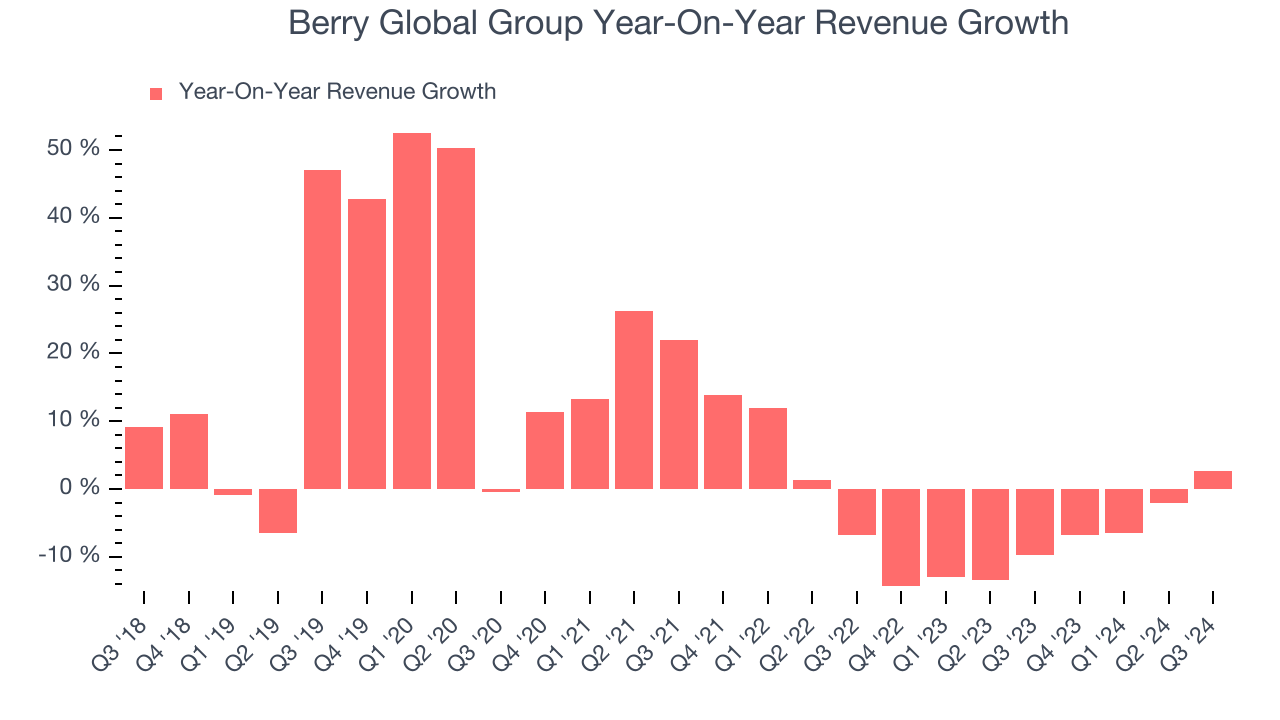
This quarter, Berry Global Group reported modest year-on-year revenue growth of 2.6% but beat Wall Street’s estimates by 1.1%.
Looking ahead, sell-side analysts expect revenue to grow 2.1% over the next 12 months, an improvement versus the last two years. Although this projection indicates its newer products and services will fuel better performance, it is still below the sector average.
When a company has more cash than it knows what to do with, buying back its own shares can make a lot of sense–as long as the price is right. Luckily, we’ve found one, a low-priced stock that is gushing free cash flow AND buying back shares. Click here to claim your Special Free Report on a fallen angel growth story that is already recovering from a setback.
Operating Margin
Operating margin is one of the best measures of profitability because it tells us how much money a company takes home after procuring and manufacturing its products, marketing and selling those products, and most importantly, keeping them relevant through research and development.
Berry Global Group has done a decent job managing its cost base over the last five years. The company has produced an average operating margin of 8.8%, higher than the broader industrials sector.
Analyzing the trend in its profitability, Berry Global Group’s annual operating margin decreased by 2.4 percentage points over the last five years. Even though its historical margin is high, shareholders will want to see Berry Global Group become more profitable in the future.
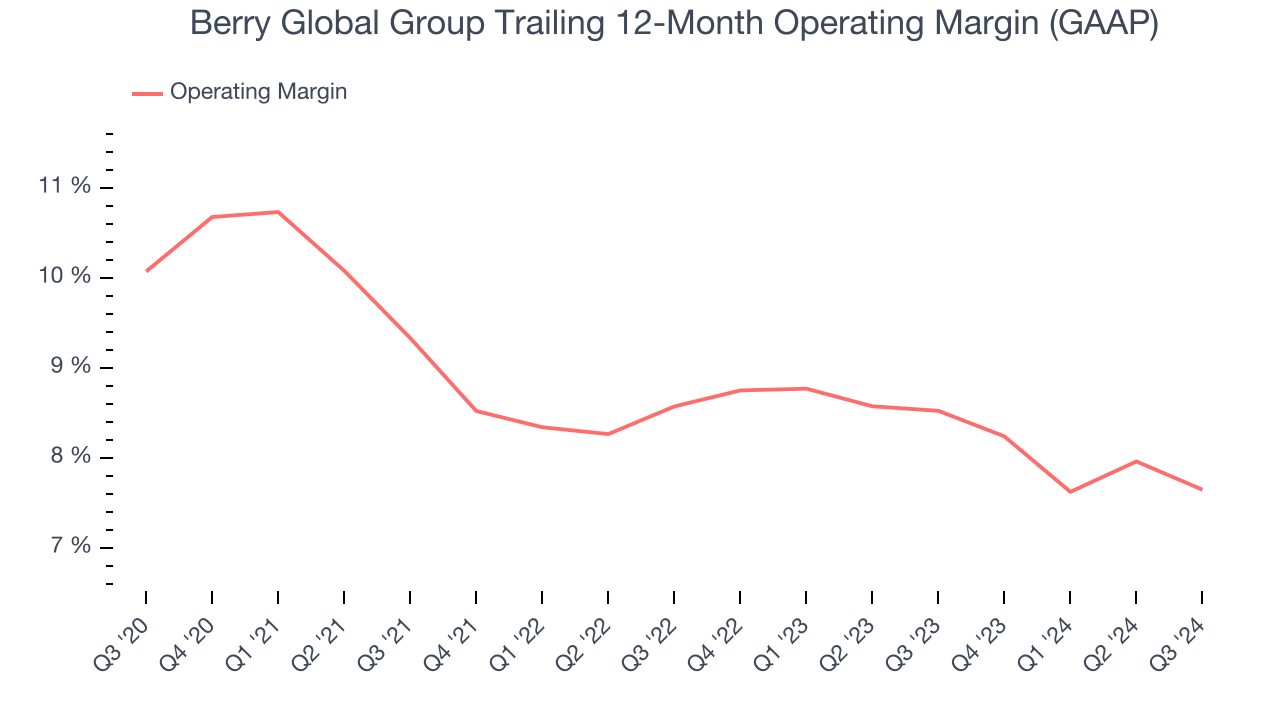
This quarter, Berry Global Group generated an operating profit margin of 8.5%, down 1.3 percentage points year on year. Since Berry Global Group’s operating margin decreased more than its gross margin, we can assume it was recently less efficient because expenses such as marketing, R&D, and administrative overhead increased.
Earnings Per Share
Revenue trends explain a company’s historical growth, but the long-term change in earnings per share (EPS) points to the profitability of that growth – for example, a company could inflate its sales through excessive spending on advertising and promotions.
Berry Global Group’s EPS grew at a spectacular 17.4% compounded annual growth rate over the last five years, higher than its 6.7% annualized revenue growth. However, this alone doesn’t tell us much about its business quality because its operating margin didn’t expand.
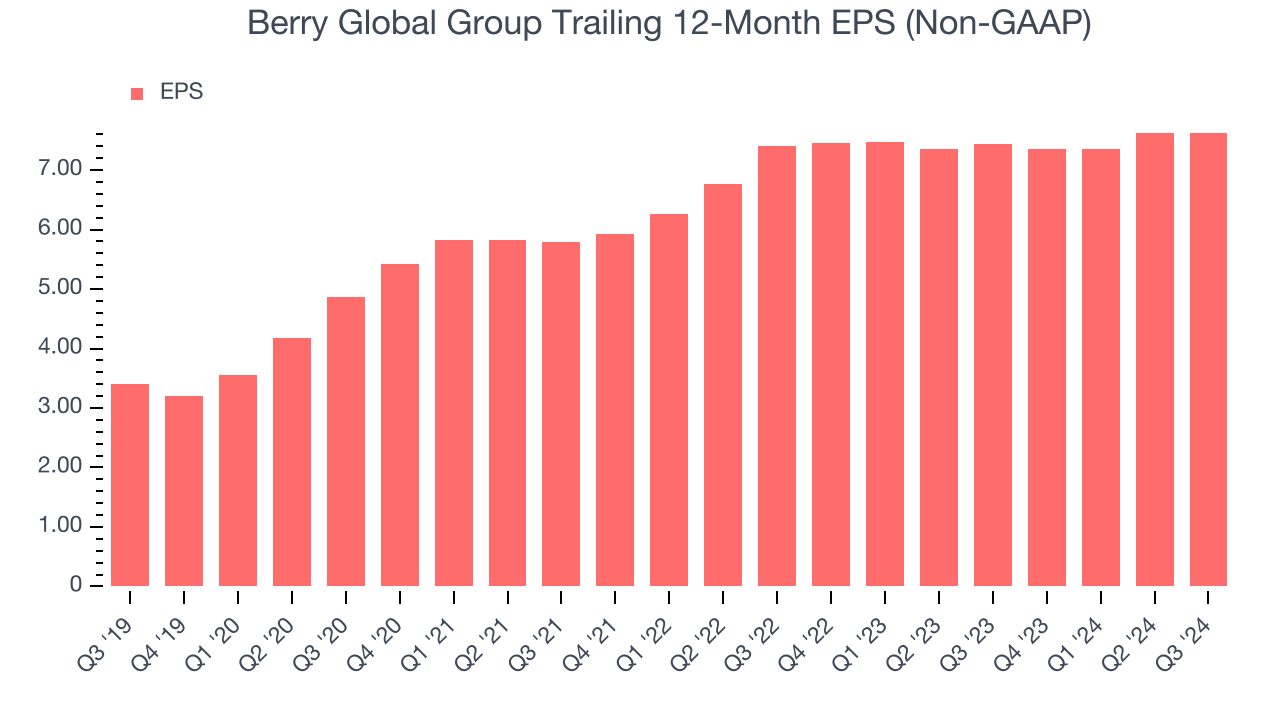
Diving into the nuances of Berry Global Group’s earnings can give us a better understanding of its performance. A five-year view shows that Berry Global Group has repurchased its stock, shrinking its share count by 12.6%. This tells us its EPS outperformed its revenue not because of increased operational efficiency but financial engineering, as buybacks boost per share earnings. 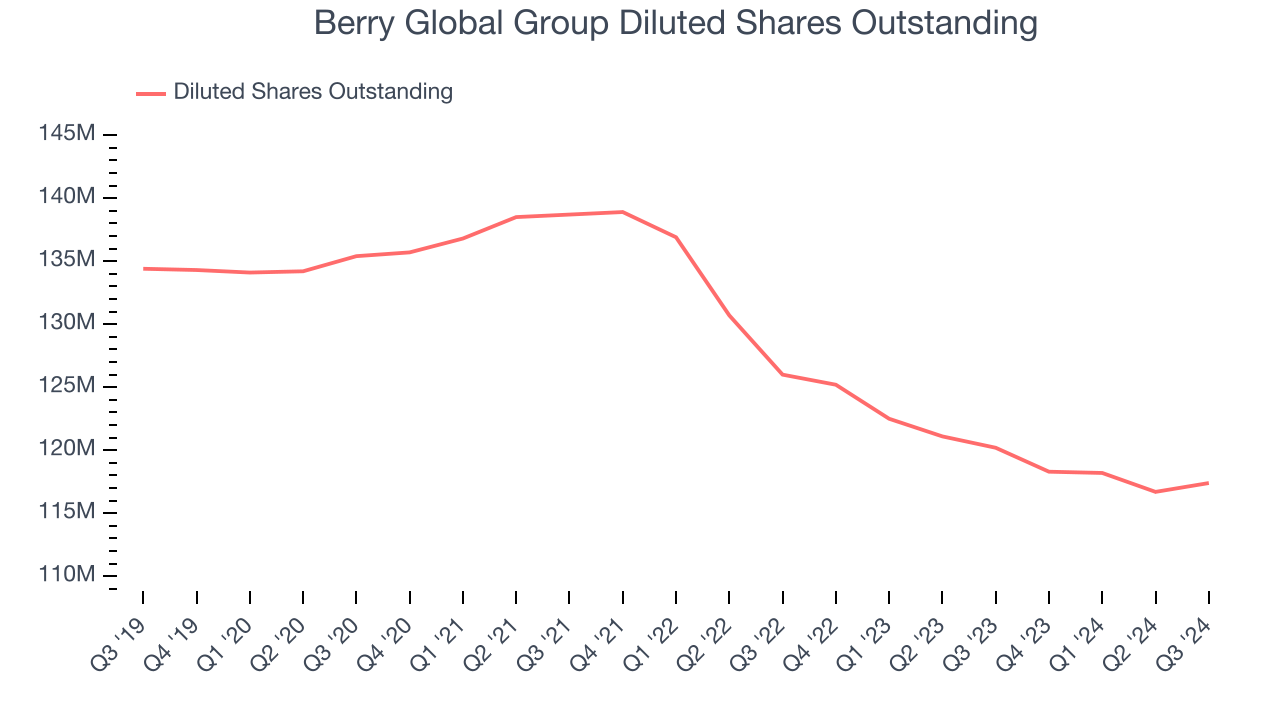
Like with revenue, we analyze EPS over a shorter period to see if we are missing a change in the business.
For Berry Global Group, its two-year annual EPS growth of 1.5% was lower than its five-year trend. We hope its growth can accelerate in the future.In Q3, Berry Global Group reported EPS at $2.27, down from $2.28 in the same quarter last year. Despite falling year on year, this print beat analysts’ estimates by 1%. Over the next 12 months, Wall Street expects Berry Global Group’s full-year EPS of $7.62 to grow by 7.6%.
Key Takeaways from Berry Global Group’s Q3 Results
It was good to see Berry Global Group narrowly top analysts’ revenue expectations this quarter. On the other hand, its full-year EPS guidance missed significantly and its adjusted operating income fell meaningfully short of Wall Street’s estimates. Overall, this was a softer quarter. The stock was down 1% after reporting.
So should you invest in Berry Global Group right now? We think that the latest quarter is only one piece of the longer-term business quality puzzle. Quality, when combined with valuation, can help determine if the stock is a buy. We cover that in our actionable full research report which you can read here, it’s free.
