Gas handling company Chart (NYSE: GTLS) missed Wall Street’s revenue expectations in Q3 CY2025 as sales rose 3.6% year on year to $1.10 billion. Its non-GAAP profit of $2.78 per share was 11.2% below analysts’ consensus estimates.
Is now the time to buy Chart? Find out by accessing our full research report, it’s free for active Edge members.
Chart (GTLS) Q3 CY2025 Highlights:
- On July 28, 2025 Baker Hughes (NASDAQ: BKR) and Chart entered into a definitive agreement for Baker Hughes to acquire all outstanding shares of Chart’s common stock for $210 per share in cash. The deal is expected to close in mid-2026
- Revenue: $1.10 billion vs analyst estimates of $1.17 billion (3.6% year-on-year growth, 6.3% miss)
- Adjusted EPS: $2.78 vs analyst expectations of $3.13 (11.2% miss)
- Adjusted EBITDA: $277.1 million vs analyst estimates of $308.8 million (25.2% margin, 10.3% miss)
- Operating Margin: -8%, down from 16.8% in the same quarter last year
- Free Cash Flow Margin: 8.6%, down from 16.4% in the same quarter last year
- Backlog: $6.05 billion at quarter end, up 33.4% year on year
- Market Capitalization: $8.97 billion
“Our commercial momentum continues, with a third consecutive quarter of sequential orders growth driven by continued strength in our end markets, especially in LNG and data centers as customers are increasingly utilizing our full solutions and process technologies,” stated Jill Evanko, Chart Industries’ CEO and President.
Company Overview
Installing the first bulk Co2 tank for McDonalds’s sodas, Chart (NYSE: GTLS) provides equipment to store and transport gasses.
Revenue Growth
A company’s long-term sales performance can indicate its overall quality. Even a bad business can shine for one or two quarters, but a top-tier one grows for years. Over the last five years, Chart grew its sales at an incredible 29.3% compounded annual growth rate. Its growth surpassed the average industrials company and shows its offerings resonate with customers, a great starting point for our analysis.
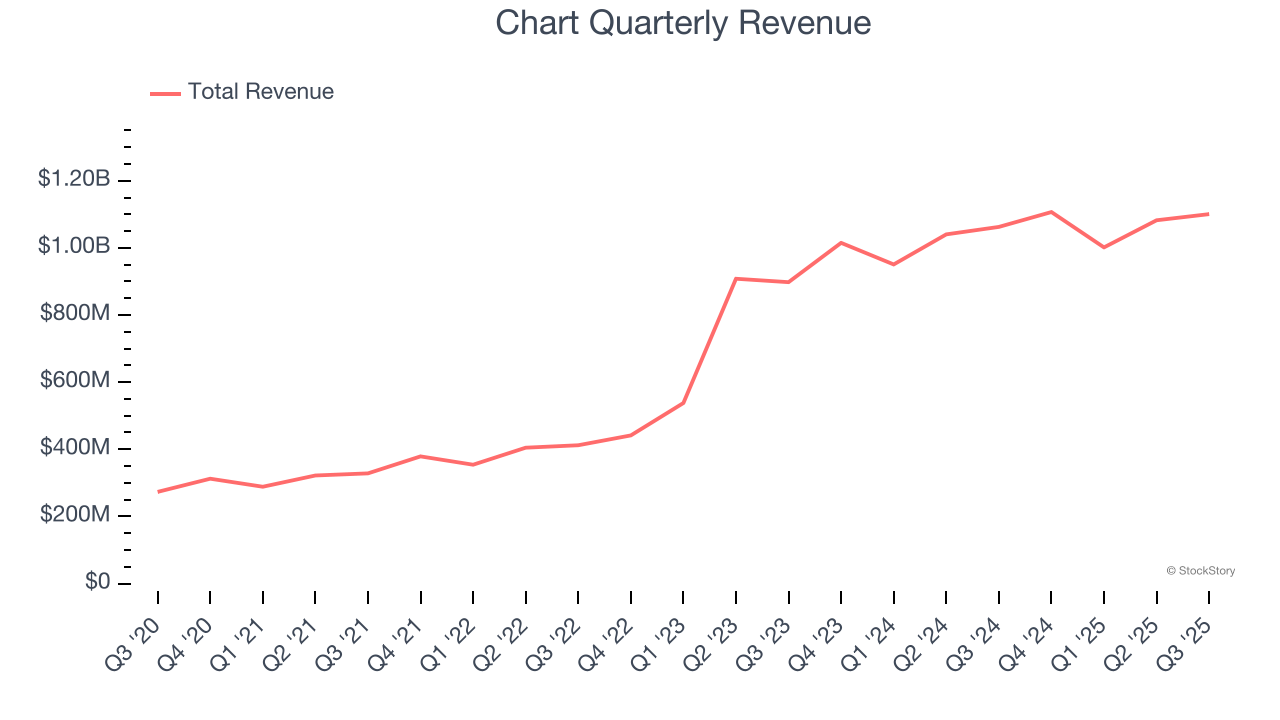
Long-term growth is the most important, but within industrials, a half-decade historical view may miss new industry trends or demand cycles. Chart’s annualized revenue growth of 24.1% over the last two years is below its five-year trend, but we still think the results suggest healthy demand. 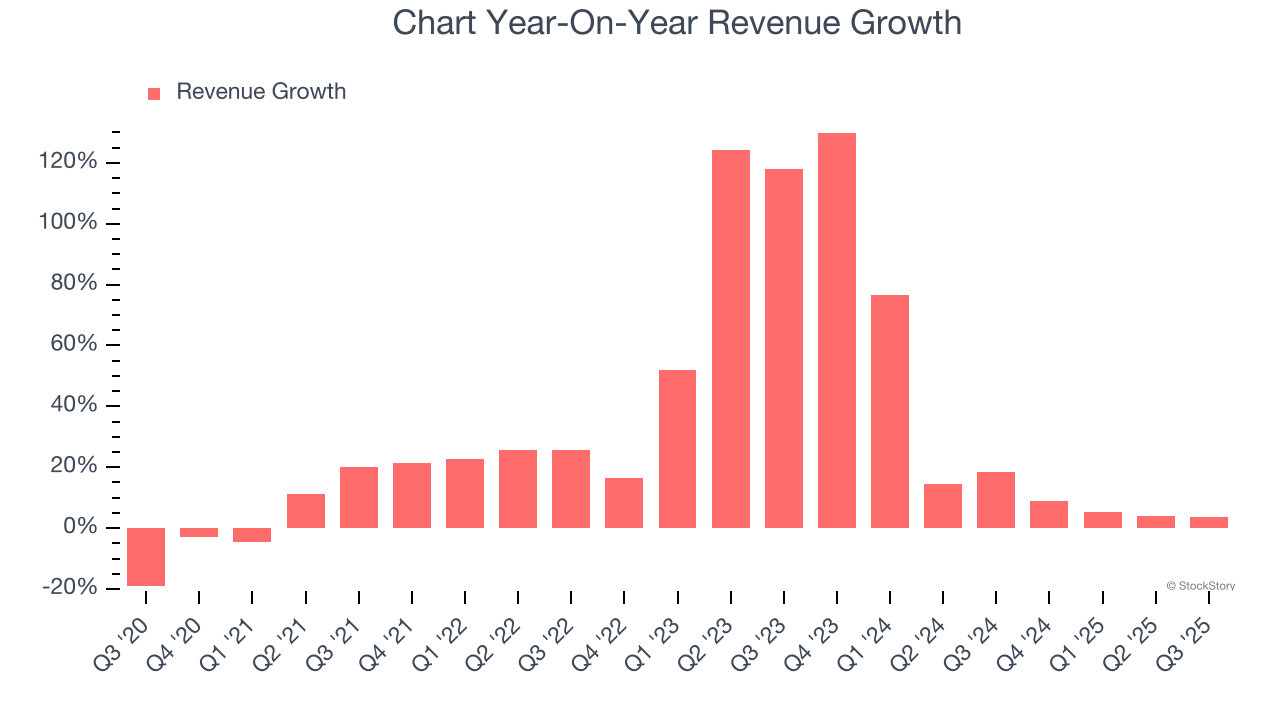
Chart also reports its backlog, or the value of its outstanding orders that have not yet been executed or delivered. Chart’s backlog reached $6.05 billion in the latest quarter and averaged 25.6% year-on-year growth over the last two years. Because this number is in line with its revenue growth, we can see the company effectively balanced its new order intake and fulfillment processes. 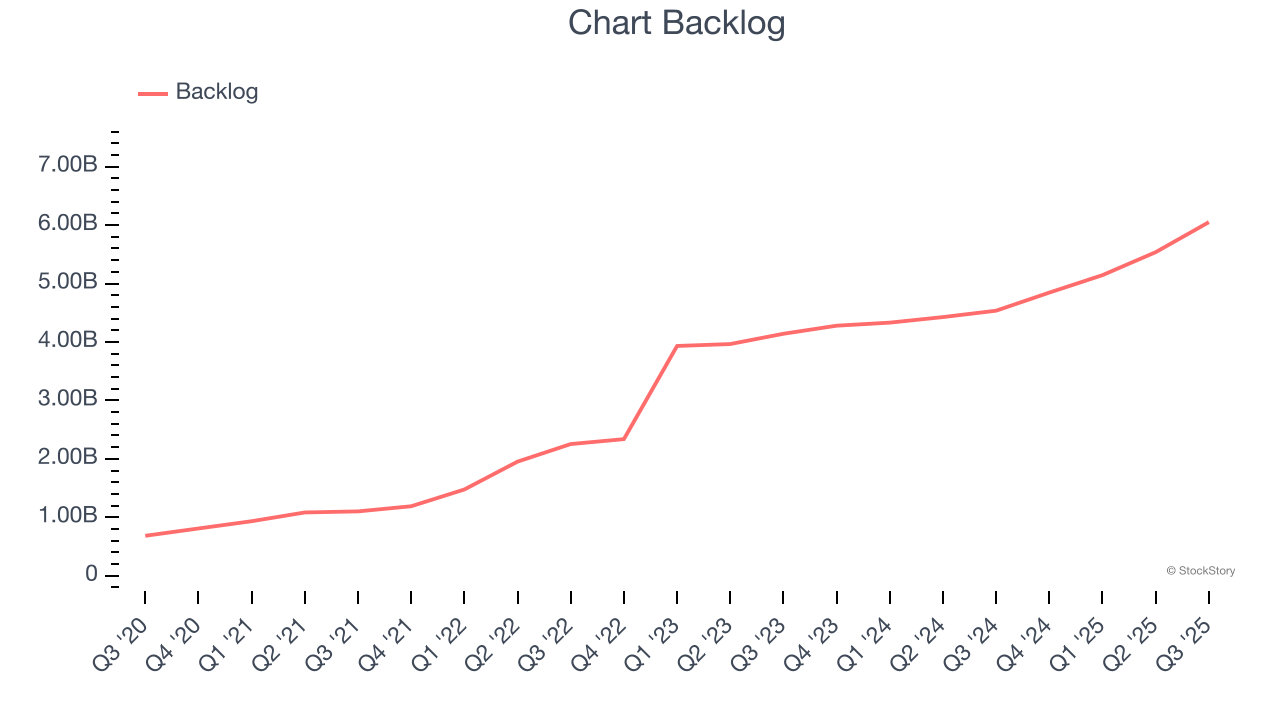
This quarter, Chart’s revenue grew by 3.6% year on year to $1.10 billion, falling short of Wall Street’s estimates.
Looking ahead, sell-side analysts expect revenue to grow 14.3% over the next 12 months, a deceleration versus the last two years. Despite the slowdown, this projection is admirable and suggests the market sees success for its products and services.
Today’s young investors won’t have read the timeless lessons in Gorilla Game: Picking Winners In High Technology because it was written more than 20 years ago when Microsoft and Apple were first establishing their supremacy. But if we apply the same principles, then enterprise software stocks leveraging their own generative AI capabilities may well be the Gorillas of the future. So, in that spirit, we are excited to present our Special Free Report on a profitable, fast-growing enterprise software stock that is already riding the automation wave and looking to catch the generative AI next.
Operating Margin
Operating margin is an important measure of profitability as it shows the portion of revenue left after accounting for all core expenses – everything from the cost of goods sold to advertising and wages. It’s also useful for comparing profitability across companies with different levels of debt and tax rates because it excludes interest and taxes.
Chart has managed its cost base well over the last five years. It demonstrated solid profitability for an industrials business, producing an average operating margin of 11%.
Looking at the trend in its profitability, Chart’s operating margin rose by 2.6 percentage points over the last five years, as its sales growth gave it operating leverage.
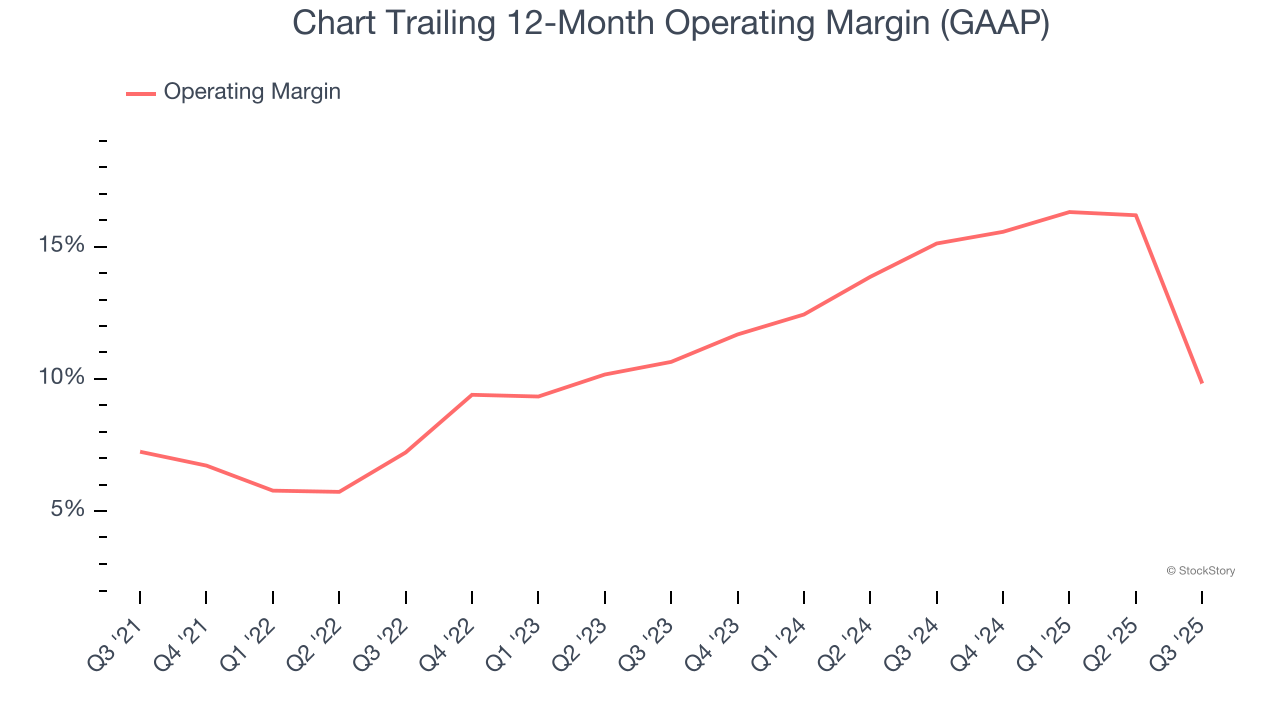
In Q3, Chart generated an operating margin profit margin of negative 8%, down 24.8 percentage points year on year. Since Chart’s operating margin decreased more than its gross margin, we can assume it was less efficient because expenses such as marketing, R&D, and administrative overhead increased.
Earnings Per Share
We track the long-term change in earnings per share (EPS) for the same reason as long-term revenue growth. Compared to revenue, however, EPS highlights whether a company’s growth is profitable.
Chart’s astounding 29.5% annual EPS growth over the last five years aligns with its revenue performance. This tells us its incremental sales were profitable.
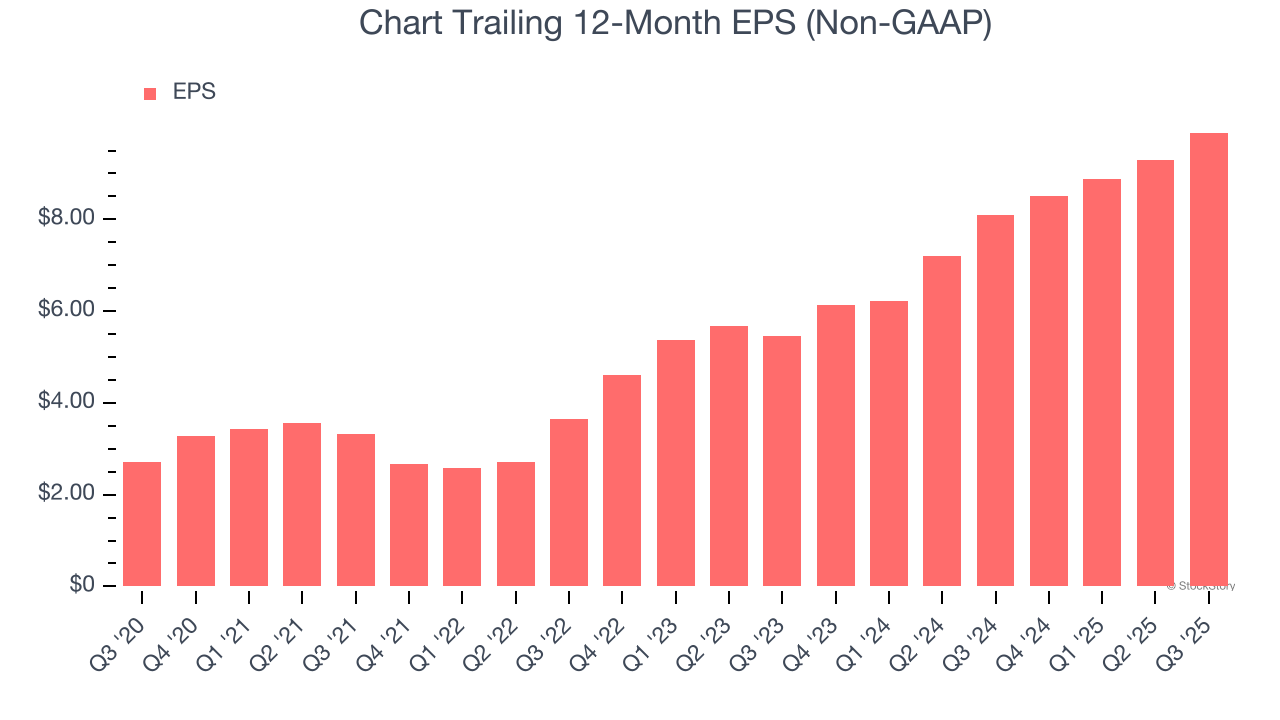
Like with revenue, we analyze EPS over a more recent period because it can provide insight into an emerging theme or development for the business.
Chart’s two-year annual EPS growth of 34.6% was fantastic and topped its 24.1% two-year revenue growth.
We can take a deeper look into Chart’s earnings quality to better understand the drivers of its performance. A two-year view shows that Chart has repurchased its stock, shrinking its share count by 5.6%. This tells us its EPS outperformed its revenue not because of increased operational efficiency but financial engineering, as buybacks boost per share earnings. 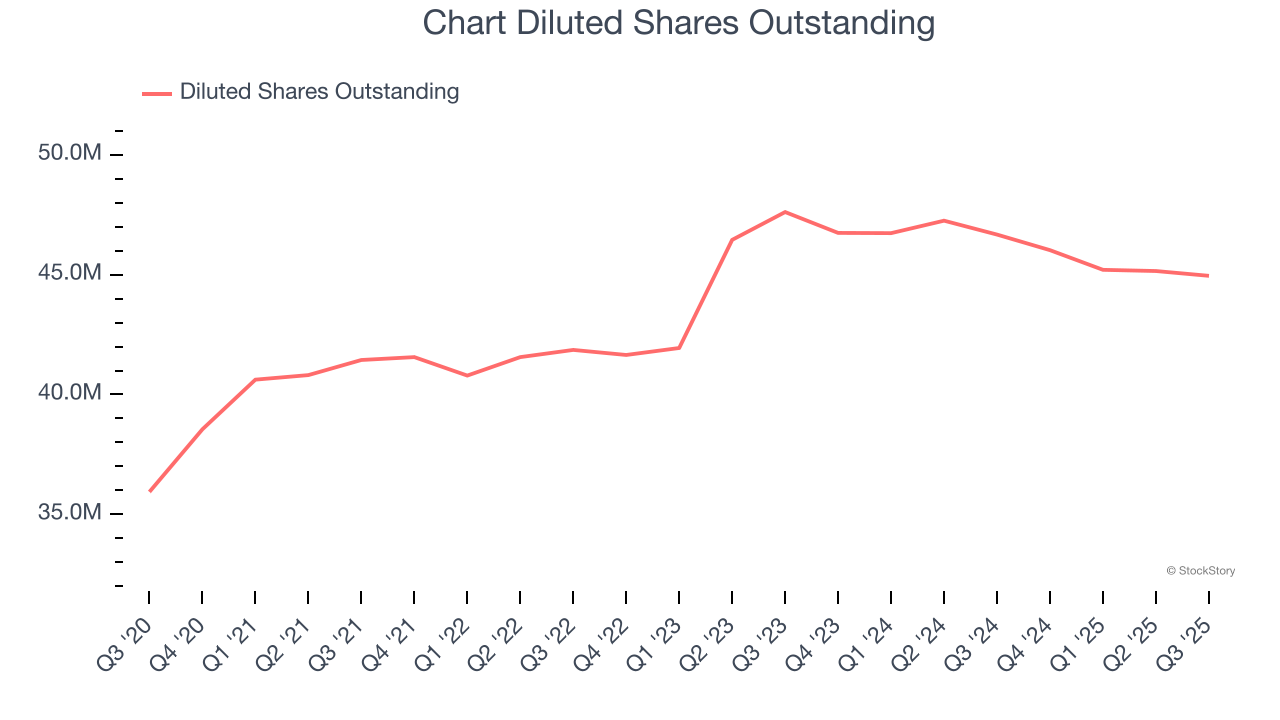
In Q3, Chart reported adjusted EPS of $2.78, up from $2.18 in the same quarter last year. Despite growing year on year, this print missed analysts’ estimates, but we care more about long-term adjusted EPS growth than short-term movements. Over the next 12 months, Wall Street expects Chart’s full-year EPS of $9.89 to grow 40.9%.
Key Takeaways from Chart’s Q3 Results
We liked that Chart beat analysts’ backlog expectations this quarter. On the other hand, its revenue missed and its EBITDA fell short of Wall Street’s estimates. Overall, this quarter could have been better. The stock remained flat at $200.50 immediately following the results.
On July 28, 2025 Baker Hughes (NASDAQ: BKR) and Chart entered into a definitive agreement for Baker Hughes to acquire all outstanding shares of Chart’s common stock for $210 per share in cash. The deal is expected to close in mid-2026.
Big picture, is Chart a buy here and now? If you’re making that decision, you should consider the bigger picture of valuation, business qualities, as well as the latest earnings. We cover that in our actionable full research report which you can read here, it’s free for active Edge members.