Qualcomm, Inc. (NQ:QCOM)
Price and Volume
Detailed Quote| Volume | 4,414,566 |
| Open | 172.07 |
| Bid (Size) | 175.43 (300) |
| Ask (Size) | 175.53 (500) |
| Prev. Close | 172.83 |
| Today's Range | 171.47 - 176.97 |
| 52wk Range | 121.99 - 259.92 |
| Shares Outstanding | 1,128,000,000 |
| Dividend Yield | 2.10% |
Top News
More News

Performance
52-Week Range
32.5% below 52-week high
175.49
121.9952W Low
259.9252W High
1 Week
2.0% below 1-week high
171.131W Low
178.991W High
Qualcomm, Inc. (QCOM) traded between $121.99 and $259.92 over the past 52 weeks and last traded at $175.49, 32.5% below its 52-week high. Over the past week it ranged between $171.13 and $178.99.
Past 12 Months
1W
+$3.38
1M
-$22.78
3M
+$4.38
6M
+$41.54
YTD
+$2.51
1Y
+$6.22
QCOM was +3.7% over the past year, +31.0% over six months, +1.5% year to date, +2.0% in the last week.
12 Months vs Market
QCOM
+3.7%
DIA
+12.0%
SPY
+13.8%
QQQ
+16.3%
IWM
+13.4%
Over the past 12 months QCOM returned +3.7% versus DIA (Dow) +12.0%, SPY (S&P 500) +13.8%, QQQ (Nasdaq 100) +16.3% and IWM (Russell 2000) +13.4%.
Volume & Liquidity
0.37× 3-mo avg
Today 4,414,566
3-mo avg 12.0M
1W
10.4M
1M
10.6M
3M
12.0M
6M
17.6M
YTD
15.2M
1Y
14.3M
QCOM most recently traded 4,414,566 shares against a 3-month average daily volume of 12.0M.
More News
Read More
1 large-cap stock to keep an eye on and 2 we brush off
Today 0:40 EDT
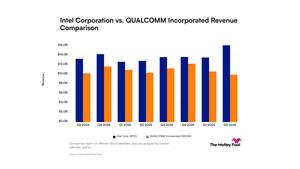
Intel vs. Qualcomm: A Widening Gap in Revenue ↗
October 22, 2026

3 Semiconductor Stocks We’re Skeptical Of
October 21, 2026


Intel vs. Qualcomm: Which Tech Stock Is a Better Buy in 2026? ↗
October 15, 2026



Best Semiconductor Stocks to Buy in October: Marvell vs. Qualcomm ↗
October 13, 2026

Broadcom vs. Qualcomm: Which Chip Stock Is a Better Buy in 2026? ↗
October 12, 2026

Own Both VOO and QQQM? You May Be Buying the Same Stocks Twice. ↗
October 12, 2026

Qualcomm Doesn't Look Cheap Next to Its AI Chip Peers. Here's Why. ↗
October 11, 2026

1 Ridiculously Cheap Semiconductor Stock I Just Bought ↗
October 10, 2026


Better Artificial Intelligence Stock: ASML vs. QUALCOMM ↗
October 09, 2026
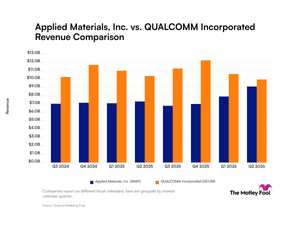
1 Cash-Producing Stock on Our Watchlist and 2 That Underwhelm
October 08, 2026

Broadcom vs. Qualcomm: Rapid Growth vs. Flat Revenue ↗
October 07, 2026

Frequently Asked Questions
Is Qualcomm, Inc. publicly traded?
Yes, Qualcomm, Inc. is publicly traded.
What exchange does Qualcomm, Inc. trade on?
Qualcomm, Inc. trades on the Nasdaq Stock Market
What is the ticker symbol for Qualcomm, Inc.?
The ticker symbol for Qualcomm, Inc. is QCOM on the Nasdaq Stock Market
What is the current price of Qualcomm, Inc.?
The current price of Qualcomm, Inc. is 175.49
When was Qualcomm, Inc. last traded?
The last trade of Qualcomm, Inc. was at 10/23/26 03:53 PM ET
What is the market capitalization of Qualcomm, Inc.?
The market capitalization of Qualcomm, Inc. is 197.95B
How many shares of Qualcomm, Inc. are outstanding?
Qualcomm, Inc. has 198B shares outstanding.
Stock Quote API & Stock News API supplied by www.cloudquote.io
Quotes delayed at least 20 minutes.
By accessing this page, you agree to the Privacy Policy and Terms Of Service.
Quotes delayed at least 20 minutes.
By accessing this page, you agree to the Privacy Policy and Terms Of Service.
© 2025 FinancialContent. All rights reserved.