Williams Companies (NY:WMB)
Price and Volume
Detailed Quote| Volume | 4,016,721 |
| Open | 75.42 |
| Bid (Size) | 74.31 (500) |
| Ask (Size) | 75.02 (500) |
| Prev. Close | 75.45 |
| Today's Range | 74.11 - 75.81 |
| 52wk Range | 55.82 - 80.08 |
| Shares Outstanding | 1,214,958,829 |
| Dividend Yield | 2.80% |
Top News
More News

Performance
More News
Read More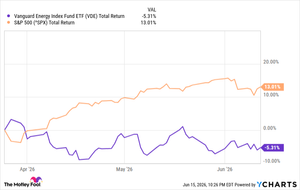


Energy Cycle Upside or Midstream Income? XOP vs. MLPX ↗
June 02, 2026


2 High-Yield Energy Stocks to Buy and Hold Forever ↗
May 23, 2026


MarketBeat Week in Review – 05/04 - 05/08 ↗
May 09, 2026


Williams (WMB) Q1 2026 Earnings Transcript ↗
May 05, 2026

Williams Announces Record First-Quarter 2026 Results
May 04, 2026
Williams (WMB) Q3 2025 Earnings Transcript ↗
May 04, 2026

Prediction: Energy Transfer Will Hit $25 in 2026 ↗
May 01, 2026

Williams Announces Quarterly Cash Dividend
April 28, 2026
Frequently Asked Questions
Is Williams Companies publicly traded?
Yes, Williams Companies is publicly traded.
What exchange does Williams Companies trade on?
Williams Companies trades on the New York Stock Exchange
What is the ticker symbol for Williams Companies?
The ticker symbol for Williams Companies is WMB on the New York Stock Exchange
What is the current price of Williams Companies?
The current price of Williams Companies is 75.02
When was Williams Companies last traded?
The last trade of Williams Companies was at 07/10/26 07:00 PM ET
What is the market capitalization of Williams Companies?
The market capitalization of Williams Companies is 91.15B
How many shares of Williams Companies are outstanding?
Williams Companies has 91B shares outstanding.
Stock Quote API & Stock News API supplied by www.cloudquote.io
Quotes delayed at least 20 minutes.
By accessing this page, you agree to the Privacy Policy and Terms Of Service.
Quotes delayed at least 20 minutes.
By accessing this page, you agree to the Privacy Policy and Terms Of Service.
© 2025 FinancialContent. All rights reserved.