MSCI EAFE ETF (NY:EFA)
Price and Volume
Detailed Quote| Volume | 2,270,723 |
| Open | 103.42 |
| Bid (Size) | 103.31 (600) |
| Ask (Size) | 103.32 (8,300) |
| Prev. Close | 103.40 |
| Today's Range | 103.16 - 103.42 |
| 52wk Range | 91.21 - 108.89 |
| Shares Outstanding | 7,026,000 |
| Dividend Yield | 3.17% |
Top News
More News

Performance
52-Week Range
5.1% below 52-week high
103.31
91.2152W Low
108.8952W High
1 Week
1.3% below 1-week high
102.001W Low
104.701W High
MSCI EAFE ETF (EFA) traded between $91.21 and $108.89 over the past 52 weeks and last traded at $103.31, 5.1% below its 52-week high. Over the past week it ranged between $102.00 and $104.70.
Past 12 Months
1W
-$0.72
1M
-$3.39
3M
+$0.07
6M
+$0.50
YTD
+$6.27
1Y
+$10.33
EFA was +11.1% over the past year, +0.5% over six months, +6.5% year to date, -0.7% in the last week.
12 Months vs Market
EFA
+11.1%
DIA
+12.5%
SPY
+17.5%
QQQ
+24.2%
IWM
+14.0%
Over the past 12 months EFA returned +11.1% versus DIA (Dow) +12.5%, SPY (S&P 500) +17.5%, QQQ (Nasdaq 100) +24.2% and IWM (Russell 2000) +14.0%.
Volume & Liquidity
0.20× 3-mo avg
Today 2,270,723
3-mo avg 11.5M
1W
13.8M
1M
14.8M
3M
11.5M
6M
12.8M
YTD
16.7M
1Y
16.8M
EFA most recently traded 2,270,723 shares against a 3-month average daily volume of 11.5M.
More News
Read More
Why Is NBIS Stock Soaring Pre-Market Today? ↗
March 16, 2026


NBIS Stock Tanks Amid CoreWeave Decline — What Does Retail Think? ↗
February 27, 2026



Is SCHF the Right International ETF for a Diversified Portfolio? ↗
February 15, 2026

First Pacific Financial Adds TCW Flexible Income ETF Shares ↗
January 18, 2026

Capture the Rally With These Dividend Plus Growth ETFs ↗
November 17, 2025




Avoiding Greed ↗
April 19, 2025


Did Stocks Just Make A Major Low? ↗
April 12, 2025
Coming European Stock Resurgence ↗
March 31, 2025

“We’re In A Stock Pickers Market” ↗
March 22, 2025
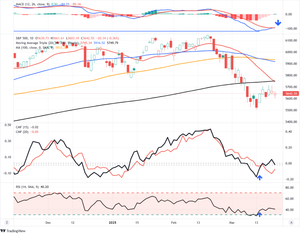
Is The Correction Over? ↗
March 22, 2025
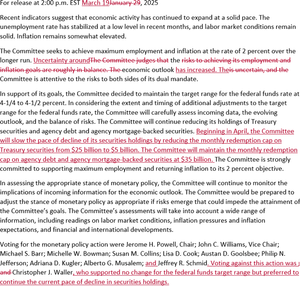
The FOMC Shifts To A Dovish Tone ↗
March 20, 2025

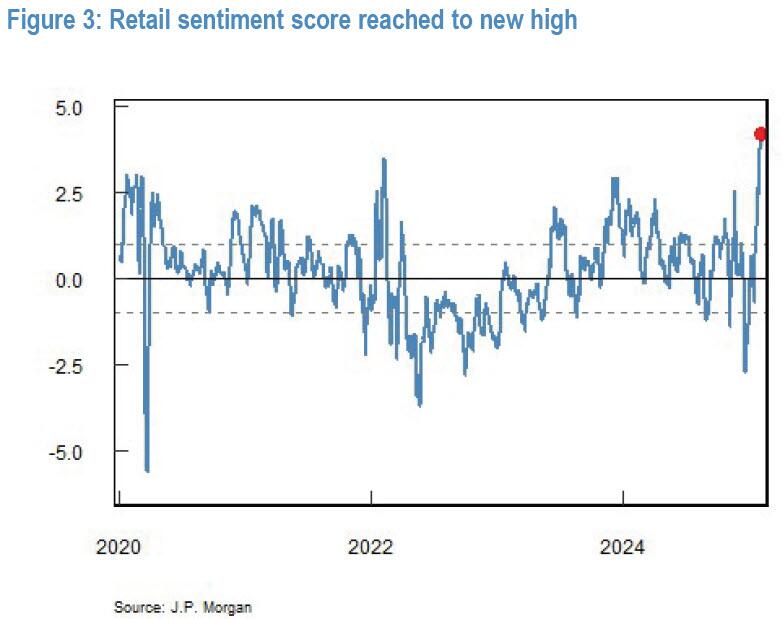
Retail Exuberance Sets Market Up For A Correction ↗
February 18, 2025


Gap Fillers ↗
February 03, 2025
Frequently Asked Questions
Is MSCI EAFE ETF publicly traded?
Yes, MSCI EAFE ETF is publicly traded.
What exchange does MSCI EAFE ETF trade on?
MSCI EAFE ETF trades on the New York Stock Exchange
What is the ticker symbol for MSCI EAFE ETF?
The ticker symbol for MSCI EAFE ETF is EFA on the New York Stock Exchange
What is the current price of MSCI EAFE ETF?
The current price of MSCI EAFE ETF is 103.31
When was MSCI EAFE ETF last traded?
The last trade of MSCI EAFE ETF was at 10/12/26 11:55 AM ET
What is the market capitalization of MSCI EAFE ETF?
The market capitalization of MSCI EAFE ETF is 725.86M
How many shares of MSCI EAFE ETF are outstanding?
MSCI EAFE ETF has 726M shares outstanding.
Stock Quote API & Stock News API supplied by www.cloudquote.io
Quotes delayed at least 20 minutes.
By accessing this page, you agree to the Privacy Policy and Terms Of Service.
Quotes delayed at least 20 minutes.
By accessing this page, you agree to the Privacy Policy and Terms Of Service.
© 2025 FinancialContent. All rights reserved.