What’s more important when analyzing a stock — the company’s numbers or the price chart?
That was the question one viewer posed during a recent episode of Market on Close:
“What should somebody be looking for to find a fair stock price? Should they use a forward P/E ratio or something else?”
Co-host “Twitter Tom” turned to John Rowland, Barchart’s Senior Market Strategist, for his take — and the answer summed up one of the biggest debates in investing.
The Analyst’s World: Fundamentals
Fundamental analysis looks at the financial health and value of a company. That includes metrics like:
- Revenue and profit growth
- Earnings per share (EPS)
- Price-to-Earnings (P/E) and Forward P/E ratios
- Debt, cash flow, and valuation multiples
It’s the world of accountants, analysts, and value investors. The goal? To determine what a company is worth and whether the current price is fair, cheap, or expensive.
“I’ll leave fundamentals to the analysts,” John said.
“They spend their whole life doing this — and fundamentals are particularly challenging for tech stocks,” Tom responds.
That’s because traditional fundamental metrics often break down in hyper-growth industries like artificial intelligence (AI) or cloud computing.
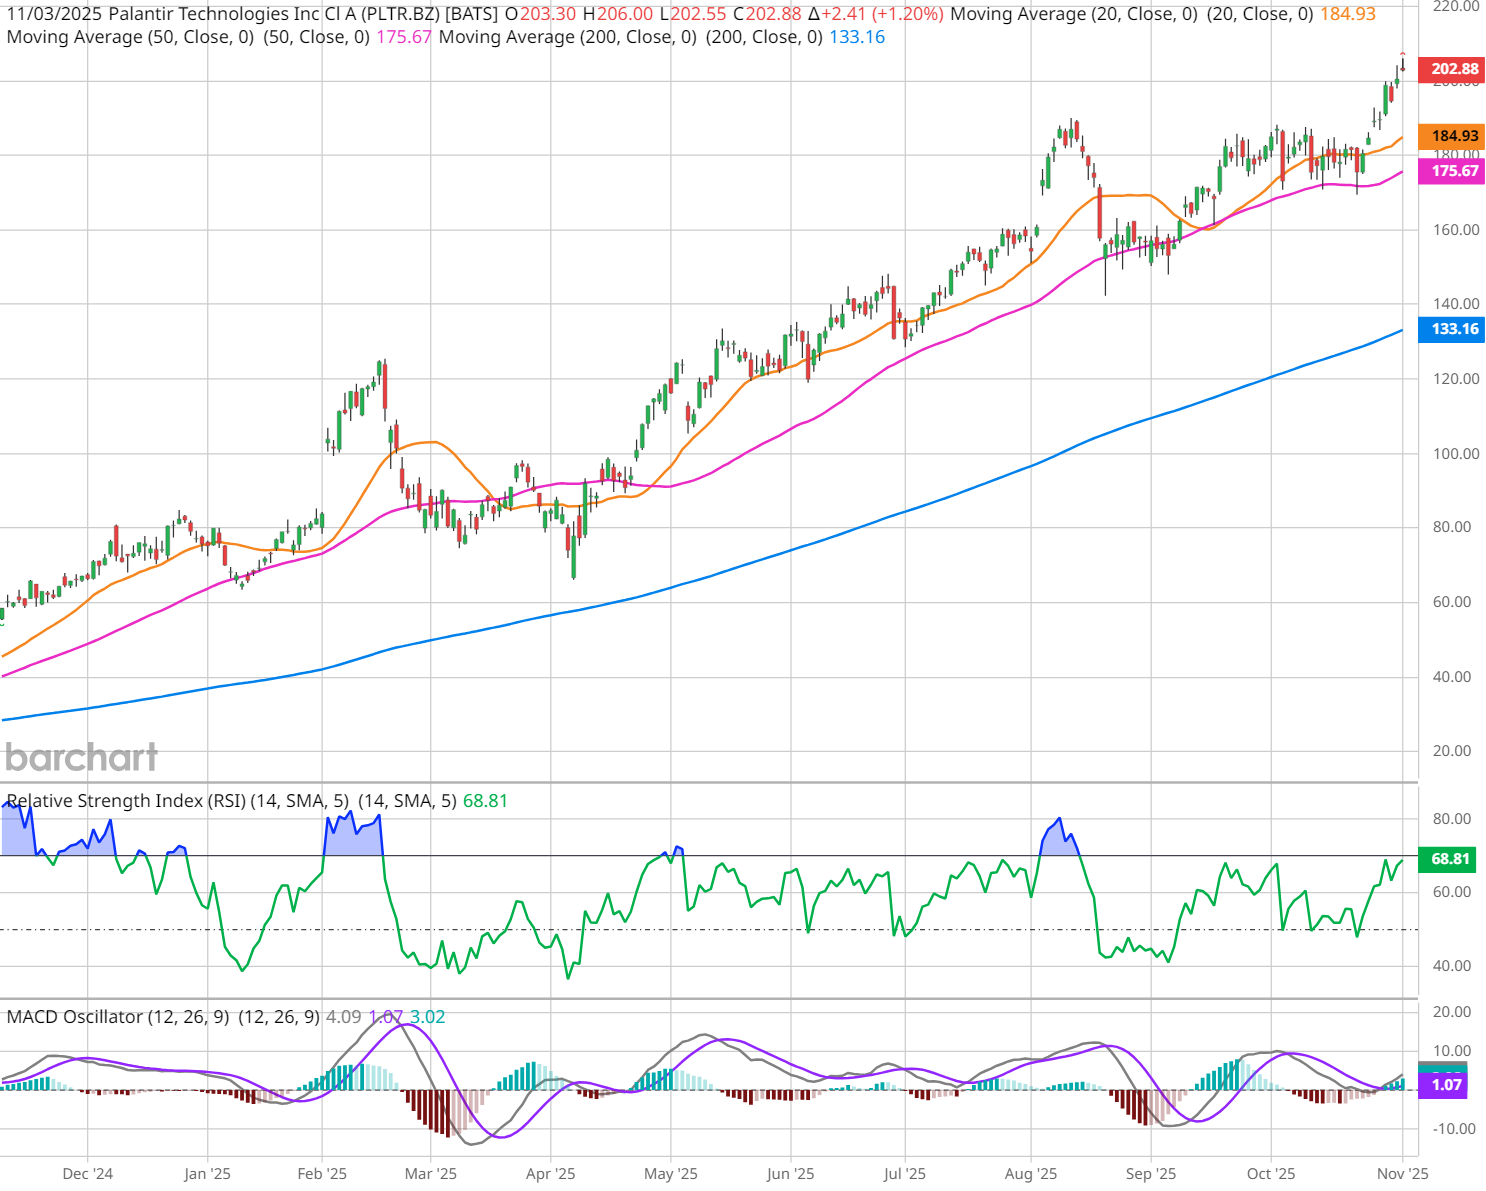
The Palantir Example: When Fundamentals Stop Making Sense
Take Palantir (PLTR), the AI company that’s become a poster child for high expectations.
Even after years of growth and hype around artificial intelligence, Palantir’s forward P/E ratio sits at over 400. Ahead of tonight’s quarterly earnings, in fact, the metric stands at a towering 464.58, to be specific.
What does that mean?
The price/earnings (P/E) ratio compares a company’s stock price to its annual earnings per share. A forward P/E uses future projected earnings.
So when a company trades at over 400x forward earnings, it means investors are paying more than $400 for every expected $1 of next year’s profit.
“How do you value that when you’re so far off from what the market thinks?” John asked. “It’s disconnected from fundamental analysis.”
In other words, investors aren’t buying Palantir for what it earns today; they’re betting on what it might earn years down the road. That’s why fundamentals alone can sometimes mislead traders, especially in growth-heavy sectors.
The Technician’s View: Let Price Tell the Story
John and Tom both agree: price structure tells the real story.
“I believe in the efficient market theory,” John explained. “All available information is already reflected in the price. So I lean on the technicals.”
Technical analysis focuses on:
- Price patterns (trends, breakouts, support/resistance)
- Momentum indicators like RSI and MACD
- Moving averages
- Volume and volatility
While fundamentals can help identify what to buy, technicals help identify when to buy (or sell).
Think of it like this:
- Fundamentals are the map.
- Technicals are the compass.
Both are useful, but applying them both together gives you the clearest direction.
How to Use Fundamental & Technical Analysis Together on Barchart
Barchart gives traders access to both sides of the equation:
For Fundamentals:
- Key Statistics — P/E, revenue, EPS, and valuation data.
- Earnings Estimates — see analyst ratings and earnings history.
For Technicals:
- Trader’s Cheat Sheet — identify support and resistance levels.
- Barchart Opinion — spot technical signals based on 13 indicators.
By layering both, traders can spot fundamentally strong stocks with technically strong setups — the sweet spot where opportunity meets timing.
The Takeaway
Fundamental analysis answers the “What should I own?” question, while technical analysis answers the “When should I act?” question.
But you don’t have to pick one — and the best traders know how to blend both.
“Price tells the story,” John said. “But understanding the story behind it — that’s where fundamentals come in.”
Watch the Clip: Fundamentals vs. Technicals
- Watch the Full Market on Close Episode
- Explore Fundamental & Technical Tools on Barchart
On the date of publication, Barchart Insights did not have (either directly or indirectly) positions in any of the securities mentioned in this article. All information and data in this article is solely for informational purposes. For more information please view the Barchart Disclosure Policy here.
More news from Barchart